Every month I review the web traffic reports for my blog, and I’ve always found something rather interesting. Even though I post more information about Oracle and OWB than any other subject, Google seems to send me more traffic from queries like “open source ETL” and “open source OLAP.” You know what they say, customer is king and you gotta give ’em what they want!
In other words, all I needed was just a teentsee weentsee bit of an excuse to take some time to really kick the tires of the open source OLAP server Mondrian.
Some basics… Mondrian is an open source OLAP server, written in Java. It implements an MDX engine, and also exposes an XML/A interface to clients. Mondrian uses a ROLAP architecture, and ends up issuing SQL statements to a JDBC data source to retrieve and calculate. Mondrian works with Access, MySQL, postgres, and Oracle. Refer to the Mondrian architecture pages to get some more information about the architecture.
My overall impressions were positive; it’s a good core set of functionality and performs rather well. Like any Open Source project it is an alphabet soup of supporting libraries, environment variables, generators, frameworks, and takes more than the usual 10 minute commercial product install. We’re not building a kernel here, but it’s not trivial to get the examples up and running.
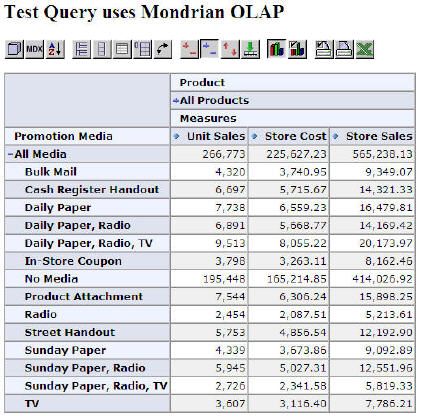
Mondrian works closely (and appropriately) with an open source implementation of a JSP based Pivot and Charting project, JPivot. The demo for Mondrian includes an example with JPivot querying Mondrian and uses the well known Food Mart demo. I was expecting a bit less from JPivot and was pleasantly surprised that it’s actually rather functional (not commercial product easy to use, but really quite commendable).

JPivot allows for drilling down hierarchies (I don’t think you can use multiple hierarchies) and Pivoting and exhanging the columns and rows. It has a “CUBE” editor that allows you to edit the report. It’s not drag and drop, but definitely works if you “grok” the interface.

Also pleasantly surprising was some pretty decent charting capabilities.

There are some decent selections of charts

In order to provide an OLAP view of your data you have to define some metadata about your Dimensional model (Cubes, Measures, Dimensions) and how they map to your underlying Relational Schema. Check out the samples on the Mondrian site to see how to write your own schema.
Couple of interesting things to point out, Mondrian implements a cache of “relations” used to increase performance. This is interesting because of consistency questions (some fragments are cached, but others are current) but also because it is WICKED fast once it’s loaded into memory. There are some interesting possibilities here, including some work with some distributed P2P OLAP distributed caching research.