Monthly Archives: January 2009

The death of prevRow = row.clone()

UPDATE: This step is available in Kettle 3.2 M1.

For those that have done more involved Kettle projects you’ll know how valuable the Javascript step is. It’s the Swiss Army knife of Kettle development. The calculator step is a nice thought, but the limited set of functions and the constriction of having to enter it in pulldowns can make more complex calculations more difficult.

Those that have done “observed metric” type calculations in Kettle will know this bit of Javascript well:

var prevRow;
var PREV_ORDER_DATE;

if ( prevRow != null && prevRow.getInteger(“customernumber”, -1) == customernumber.getInteger() )
PREV_ORDER_DATE = prevRow.getDate(“orderdate”, null);
else
PREV_ORDER_DATE = null;

prevRow = row.Clone();

This little bit of Javascript allowed you to “look forward” (or back depending on your sorting) and calculate the difference between items:

  • Watching a set of “balances” fly by and calculate the transactions (this balance – prev balance) = transaction amount
    Web Page duration (next click time – this click time) = time spent viewing this web page
    Order Status time (next order status time – this order status time) = Amount of time spent in this order status (warehouse waiting)

In other words, lining data up and peaking ahead and backwards is a common analytic calculation. In Oracle/ANSI SQL, there’s a whole set of functions that perform these type of functions.

This week I committed to the Kettle 3.2x source code a step to perform the LEAD/LAG functions that I’ve had to hand write several times in Javascript. It’s been long overdue as I told Matt I designed the step in my head two years ago and he’s been patiently waiting for me to get off my *ss and do something about it.

You can find more information about the step on its Wiki page, along with a few examples in the samples/transformations/ directory.

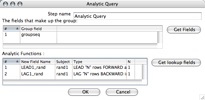
The step allows you peek N rows forward, and N rows backward over a group and grab the value and include it in the current row. The step allows you to set the group (at which to reset the LEAD/LAG), and setup each function (Name, Subject, Type, N rows)
200901301239
Using a group field (groupseq) and LEADing/LAGing ONE row (N = 1) we can get the following dataset:
200901301238
Any additional calculations (such as the difference, etc) can be calculated like any other fields.

This was my first commit to the Kettle project, and a very cool thing happened. I checked in the base step and in true open source fashion, Samatar (another dev) noticed, and created an icon for my step which was great since I had no idea what to make as the icon. Additionally, hours after my first commit he had included a French translation for the step. He and I didn’t discuss it ahead of time, or even know each other. That’s the way open source works… well. 🙂

RIP prevRow = row.clone(). You are dead to me now. Long live the Analytic Query step
select stream REAL_TIME_BI_METRIC from DATA_IN_FLIGHT

SQL is great. There are millions of people who know it, it’s semantics are standardized (well, as much as anything is ever I suppose), and it’s a great language for interacting with data. The folks at SQLstream have taken a core piece of the technology world, and turbocharged it for a whole new application: querying streams of data. You can think of what SQLstream is doing as the ‘calculus’ of SQL – not just query results of static data in databases but query results of a stream of records flowing by.

Let’s consider some of the possibilities. Remember the results aren’t a one time poll – the values will continue to be updated as the query continues.

// Select the stocks Average price over the last 10 ticks
select stream stock, avg(price) over (previous 10) from stock_ticker group by stock
// Get the running averages for the past minute, hour, and day updated
select stream stock, avg(price) over (range interval 1 minute preceding) as “AvgMinute” , avg(price) over (range interval 1 hour preceding) as “AvgHour”, avg(price) over (range interval 1 day preceding) as “AvgDay” from stock_ticker group by stock;

For a variety of reasons, I haven’t posted my demo of my real time BI analytics powered by SQLstream but figured it’s about time to at least talk about it. The demo is illustrative of a the BASIC capabilities of the SQLstream RAMMS (Relational Asynchronous Messaging Management System). Trust me, the simple stream queries I wrote are about as trivial as possible. The more complex the business needs the fancier the SQL becomes, but that’s the point where the demo turns into a real customer project.

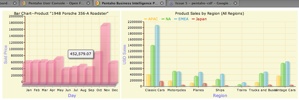
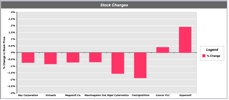
You can’t see it in just the still image below, but the bars in the bar chart are “dancing” around as events are flowing from SQLstream. It’s very very cool to watch a web dashboard update with no interaction. There’s a huge data set of stock prices being INSERTed into a stream via JDBC from one application and there’s a stream select that gives a windowed “% Change” of stock price. The application simply gets the “Stock / % Change” values over JDBC with all the complex windowing, grouping etc being done by SQLstream.

200901271717

SQLstream have announced the 2.0 release of their product. Some of you may be curious as to where the 1.x version of their product has been. To date, SQLstream hasn’t made much fanfare about their products. They’ve been selling to customers, working with the Eigenbase foundation, and have released several versions of their product over that past few years. I’ve had the chance to work with the 1.x series of their product and an early release candidate of their 2.x series and think it’s very very compelling. I very much look forward to digging into the new 2.x features soon.

In particular, and what I continue to find most fascinating, is the new aggregation features in 2.x. This will allow users of ROLAP type query systems (or simply companies with summary/aggregate tables they spend time updating) to keep these tables up to date throughout the day. This is a huge win for companies that have to update summary tables from huge transaction data sets.

Consider a common problem batch loading window. You load a million records / day. You do period batch updates of your transactions throughout the day and at midnight you kick off the big huge queries to update the “Sales by Day”, “Sales by Month”, “Sales by Qtr”, “Sales by Year”, “Sales All Time” summary tables that take hours to rebuild (going against huge fact tables). Missing the batch window means reports/business is delayed. SQLstream can ease this burden. SQLstream is efficiently calculating these summaries throughout the day (period batch loads) and at midnight simply “spits out” the summary table data. That’s a huge win for customers with a lot of data.

If you’re loading millions of records per day and you need to keep summaries up to date or have time sensitive BI applications you should definitely consider SQLstream. If you’re interested in discussing real time BI or the benefits of streaming aggregation don’t hesitate to contact Bayon ; we can help you prototype, evaluate and build a SQLstream solution

PentahoFlashChart: Basics

PentahoFlashChart is a component built for Pentaho 2.0.stable (or Enterprise Edition) that allows you to render flash charts in the User Console and Dashboards. It uses the flash library “Open Flash Chart 2.0” which is an LGPL licensed SWF. The charts are NOT available for rendering in Pentaho Reporting or Pentaho Report Designer.

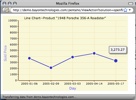
Let’s first understand what we’re talking about: Consider the following example run from Bayon’s ‘demo’ server.

NOTE: This demo server is not a 100% uptime server – if you don’t see anything above don’t worry. Check back later.

A chart can be rendered via a URL:

200901081053

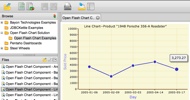
via the Pentaho User Console:

200901081054

via Dashboards (JSP/AJAX/CDF):

200901081055

The PentahoFlashChart component is intended to be used, like any other component, from an .xaction which is created in the Pentaho Design Studio.

You can follow download this example here: ofc_linechart.xaction

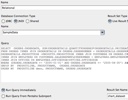
Just like any chart or report, you have to get your data for reporting. In this case, we’re getting a Relational data set from the Pentaho SampleData data source.

200901081059

We also have a “chart template” which is an XML document VERY similar (same same but different) to the pentaho chart xml definition that defines how to build the chart. It contains things like chart tile, chart type, etc. The “chart template” is really where most of the “interesting” work occurs.

<chart><chart-type>LineChart</chart-type><title>Line Chart–Product “1948 Porsche 356-A Roadster”</title><x-steps>1000</x-steps><x-max>20000</x-max><domain-title>Day</domain-title><range-title>Sold Price</range-title><y-axis><labels></labels><y-steps>1000</y-steps><y-max>10000</y-max><color>#909090</color></y-axis></chart>

Notice that this chart template has a <chart-type>LineChart</chart-type> which means that the component will output a LineChart in Open Flash Chart. The full scope of the tags, and all their functioning is beyond the scope of this intro article and it should also change. The next release of PentahoFlashChart should be 100% compatible with the Pentaho Chart XML definition. We’ll see. 🙂

This renders the flash fragment to the page, with a “callback” for the data file that has been added to the content repository.

Consider installing it into Pentaho 2.0.stable and playing with it. The sample solution comes with 11 Examples so it should be relatively easy to get going, even though it lacks good documentation.

200901081110

It’s great for dashboards, and produces some great looking (if not limited) charts.

Happy New Year 2009!

I resisted the urge to post a “2008 recap” and “2009 predictions” since that seemed to be well covered in lots of different circles/blogs.

Ahhh… Who am I kidding? I’m just lazy! 2008 was a crappy year (personally, but not professionally) and 2009 is off to a great start (personally, but not professionally)!

Already I’m very much enjoying 2009 even though the consulting work is shaping up pretty light these first few weeks.

<shamelessplug>
Need any help with Mondrian/Kettle/Pentaho? I’m available for smaller 3-20 day engagements remotely and onsite in North America.
</shamelessplug>

The best part about the start of the year, was I was able to get some time testing, updating, and deploying to my demo server the two projects that Bayon has been sponsoring over the past few months.

JDBCKettle – Allows for Kettle transformations to be used in an EII fashion. This allows you to use a (set of) kettle transformations and access via SQL.

PentahoFlashCharts – Updated to OFC 2.0 and Pentaho 2.0.stable it also includes new XML Template for building charts. Right now it’s diverged from the Pentaho chart standard but I hope to get back to the standard pentaho chart definition before this goes to an initial Beta release.

I’ll be blogging more about these projects in the coming days.

Happy New Year!