Author Archives: ngoodman

Use Open Source BI: Win a Mac Mini

Tomorrow MySQL and Pentaho are presenting on how MySQL and Pentaho can work together to deliver exceptional value when used in combination to solve Business Intelligence and Reporting business challenges.

I’ve been working more and more with MySQL over the past couple of months since joining Pentaho and I’m pleasantly surprised.  On the good side of the 80/20 rule (ie, 80% of users want 20% of the features) it’s exceptionally "good enough" for things that I want to do.

Back to the tagline.

Tomorrow, Pentaho is highlighting our desire to be as easy to MySQL users as MySQL is.  We want to understand how to make it increasingly easy to use Pentaho with MySQL.  In return for providing Pentaho with much needed feedback on ease of use and the user experience for installation/configuration Pentaho is giving away a Mac Mini.  It’s no iPod, thank heavens, as everyone is giving those away these days. 

10am PT, 1pm ET in the US.  Register and dial in here.  Read the press release here.

Roland Bouman on Pentaho Data Integration

I just got on to Roland Boumans blog.

He has an excellent write up on how to get started with Pentaho Data Integration (aka Kettle):

Kettle is a free, open source (LGPL) ETL (Extraction, Transformation and Loading) tool. The product name should actually be spelled as K.E.T.T.L.E, which is a recursive acronym for "Kettle Extraction, Transport, Transformation and Loading Environment".

….

An interesting feature of Kettle is that it is model-driven. Both Spoon and Chef offer a graphical user interface to define the ETL processes on a high level. Typically, this involves no actual programming at all – rather, it’s a purely declarative task which results in a model.

He wonders at the end about how Kettle is deployed inside of Pentaho.  That’s a great question and something Pentaho/Matt have been working at over the past few months.  Perhaps I can shed a bit of light on this.

In the latest build of Pentaho (I used 1.1.6 for the below screenshots)  we ship an example of a Kettle mapping returning a result set which demonstrates the great architectures of both Kettle and Pentaho.  Kettle provides an easy way for creating plugins and interfaces for steps allowing Pentaho to access data at the "end" of a transformation.  Pentaho has a multipurpose result set object which allows for reports to key off of "data" instead of a SQL Result or an MDX Result, or in this case, a real time data slurp (EII result?!?). 

The transformation in spoon looks like this:

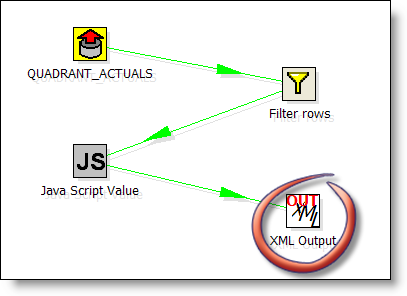
It reads data from the Pentaho sample database (QUADRANT_ACTUALS) filters, and does some calculcations and places then in an operator XML Output.  This output operator is superflous, the KettleComponent (from Pentaho) sources the data DIRECTLY from the in memory XML Output object in Kettle.

The ETL example is basic; it doesn’t even place the data slurped from Kettle into a nicely formatted report.

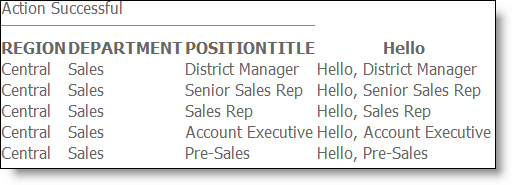
Just to be clear on what you’re seeing…

Pentaho users gain the full power of the Pentaho Data Ingegration tool (proper ETL sorts, groups, XML, csv, xml, filters, calculations, database lookups, aggregations, etc) when used as a SOURCE for their reports.  A full ETL tool where you don’t HAVE to persist the data to tables or files or anything. 

If it suits your needs, you can simply run your ETL everytime your report is run and you never have to build a staging area, data warehouse, or OLAP cubes.  Your mileage may vary and I don’t think this is wholesale replacement for a data warehouse at all!  Just a great way to provide additional options for BI developers.

Going beyond a single transformation in Pentaho we are currently augmenting this component to allow you to execute Chef Jobs from inside Pentaho.  I have no idea when that code is included in a release but I’ll be sure and blog about it here.  That means that you can schedule your "DW load process" or "Data Integration Routines" to run from inside Pentaho.  I’ll post an example of that shortly…

Again, check out Rolands article!  It’s a great addition to the pentaho blogosphere.

Mondrian: OLAP power at your USERS fingertips

As promised, todays followup on how to limit the complexity of calculated MDX measures from your users using Mondrian.

If you haven’t already, start with yesterdays blog, entitled Mondrian: OLAP power at your fingertips. We leveraged the power of MDX to quickly build a calculated MDX member. While in and of itself not all that powerful (% of total is not that tough) it provides with a quick and easy way for users to start exploring the power of MDX without having to do any XML editing, etc. You can just type it into the web browser and “try before you buy.”

Ok, so let’s say you’re sold. You’ve got your calculated measure exactly how you want; great. There’s no WAY that you’d want your users to have to see that and copy and paste that in themselves. It also leaves room for people changing formulas, which in the day and age of SOX is just a bad idea. What you want to do is make this MDX part of your Cube so that a user can just reference it, and disregard the complexity of the expression.

  1. I’m assuming that we’ve already downloaded and started the Pentaho Demo. Refer to yesterdays blogs for instructions.
  2. Edit the file $PROOT/pentaho-demo/pentaho-solutions/samples/analysis/SampleData.mondrian.xml.
  3. Add the following XML fragment right before the ending Cube tag.
    <CalculatedMember name=”Position Percent of Total” dimension=”Measures” formula=”([Measures].[Actual] / ([Measures].[Actual], [Positions].CurrentMember.Parent))” />

    What we’re doing here is tell Mondrian that we want to add a new member named Position Percent of Total to the Measures dimension (a special dimension) using the forumla we worked out yesterday. In theory, this can be any calculated member you’ve sorted out in MDX which means the full power and expressiveness of MDX can be included here.
  4. You should stop and start the server so that mondrian can pick up the schema changes.
    $PROOT/pentaho-demo/stop-pentaho.bat
    $PROOT/pentaho-demo/start-pentaho.bat
  5. Return to the analysis samples (refer to former blog to find it) and launch the slicer Slice and Dice example. Click on the Cube Navigator and then Measures to see if your new “CalculatedMember” is present:

    It should be there so that you can just uncheck the rest of the measures and only have Actual and Position Percent of Total. This is now the experience that your users would have, if they use JPivot here in the web or say the Pentaho Spreadsheet Services (a blog on that next week).
  6. If you expand the All Positions you should see your calculated measure displayed alongside the Actual measure

That’s it! This is really useful for providing your users a bunch of reusable measures (YTD, Versus Period Prior, etc) without having them have to hack it all day in Excel. Enjoy!

Mondrian: OLAP power at your fingertips

Pentaho Analysis (aka Mondrian) is a powerful OLAP tool that can wrap just about any JDBC datasource and present it multidimensionally.  There are many resources that cover how to get Mondrian connected to a database, some of the ins and outs of the the Mondrian.xml schema definition, etc.  Comment below if you’re also interested in seeing a tutorial here in that regard.

Connecting from MDX to usefullness isn’t always the easiest… How powerful is MDX?  Why would I do something in MDX versus SQL?  Why not build another measure in my fact table to support that query instead of MDX?  Well, I won’t belabor the benefits of MDX and the expressiveness of the language – there are plenty of great books and resources in that regard.

Suffice to say that it makes certain analytic queries (Year to Date, % contribution to total, this versus period prior) easy… sometimes embarrassingly easy compared to what we used to do in pure "star schema relational and SQL group by" land.

Let’s build a custom MDX measure and then in a followup I’ll show how provide this to your end users in Mondrian without this complexity.

  1. Download the latest pre configured installation (aka DEMO) of Pentaho here:
    http://www.pentaho.org/download/latest.html
  2. Unzip it into a directory on your local machine (we’ll refer to this as $PROOT from here on out).
  3. Double click on "$PROOT/pentaho-demo/start-pentaho.bat."  When you see the message "Pentaho BI Platform Ready" the platform is ready, about 2 minutes.
  4. Open up firefox (or IE) and go to the following URL
    http://localhost:8080, and then click on Samples and Examples
  5. Find Analysis examples, and click on that

    and then click on
  6. You are now viewing the JPivot application that allows you to navigate and build OLAP reports in a web browser.
  7. (Optional Step) Feel free to explore the JPivot interface at your own leisure, a great place to start is the CUBE NAVIGATOR() which gives a pretty good graphical way of navigating OLAP cubes:  Make changes, and then click on OK to make the crosstab report below change.
  8. Click on MDX to open up the MDX Editor Window
  9. Paste the following MDX into the text area and then hit APPLY:

    select NON EMPTY {[Measures].[Actual]} ON COLUMNS,
    NON EMPTY Hierarchize(Union({[Positions].[All Positions]}, [Positions].[All Positions].Children)) ON ROWS
    from [Quadrant Analysis]

    You should see the report look like this:

  10. What we’re seeing here is the rollup of all of our head count (ie, salary expenditures) by position.  The aggregate figure is nice, for the bean counters, but of interest to the analyst and executives is the "that is that in proportion to my entire enterprise?"  In other words, 1,211,073.00 on HR Training personnel is not as interesting as what % I spend on HR Training personnel as part of the total.  Let’s open paste the following calculated member into the MDX window ABOVE the current MDX statement:
    with member [Measures].[Position Percent of Total] as ‘([Measures].[Actual] / ([Measures].[Actual], [Positions].CurrentMember.Parent))’, format_string = "|#.00%|"

    Click APPLY and then Close the MDX editor (red X or the MDX button again).

    What we’ve done here is built a calculated measure that using MDX.  MDX is very powerful so I suggest you check out some MDX books or resources on the net to explore its capabilities.

  11. Now we need to add our brand new calculated measure to our report.  Click on the cube navigator, then "Measures" then highlight the new Measure we just created:

    You have to click OK twice here to get back to the report.
  12. If all has gone well, you should see the following report with your custom MDX measure:

Well, that’s great for the techies and hard core business analysts, but we’d never want to have to have an end user to have to figure all that out.  How do we buffer the user from that complexity?  That will be tomorrows blog entry on how to make a CalculatedMember in Mondrian. 

Bonus Screenshot of a pie chart in two clicks now based on our percentage:

Google Spreadsheets, pretty cool

There’s been some buzz about googles launch of their first "office-esque" product.  So, I signed up to get a preview to see what all the fuss is about.  To be honest, I was pleasantly surprised with the quality of the application.

Google Spreadsheets is a browser based spreadsheet and collaboration tool.  You make, share, save, edit your spreadsheets in a web browser. 

I was pleasantly surprised to see that it wasn’t a super light grid based notepad; it’s a real spreadsheet with formulas to do real work:

You can highlight ranges of cells, just like good ole Excel:

Overall, I was quite happy with the experience and think it will definitely be useful for individuals and SMBs.  I ponder, like others, how useful it will be in big corporate environments BUT don’t really think of it as a competitor to star office/open office. 

So when are Pivot Tables/Pivot Charts arriving… now THAT would be awesome! 🙂

Off Topic: "OK to discriminate" referendum defeated

The great state of Washington passed a law adding  "sexual orientation" to the list of groups provided anti-discrimination protection  It’s a sad state of affairs when these measures, of any form, are needed to ensure that people are civil to other people; however there are clear needs for such measures.

There’s this polictician who thought it would be a grand idea to sponsor a referendum to put to ballot a measure that specifically excludes these protections for gay and lesbians citizens.  Sad to say more than 100,000 of my fellow Washingtonians signed the measure, but calm rationale heads prevailed: 

Referendum 65 will not appear on the ballot.

JBoss and Redhat officially wed

In a JBoss community email today:

I am writing to you today to announce that the Red Hat acquisition of JBoss has closed and we now are officially a part of the largest independent open source company. I am excited about this news and the great opportunity that it represents. We are entering a new era in the technology industry that puts customers back in charge of their destiny, where innovation and value replace lock-in and costly proprietary-vendor software licenses. Together, we believe we can change the economics of the industry, delivering unmatched value to our customers and partners by creating better software faster, systematically driving down costs and simplifying IT.

Some news on it here here here as well.

That makes Redhat the largest independent Open Source company in the world. Cool.

Reporting in 60 seconds with Oracle XE

Ok, well maybe not 60 seconds but more like 5 minutes.

Some great news today from Pentaho.  Pentaho has purchased proprietary software for visually building reports and donated it to the open source community.  The full text of the announcement is here:

 More on this in a later post… Let’s get to the bits.

Much of what I’ve been hearing in the marketplace is the perception that Open Source has hidden costs in terms of usability and the technical savvy needed of users. 

Let us try and challenge this assumption and see how "productive" we can be building a simple database driven report.

Download the Report Designer here and unzip it to a directory of your choosing.  There’s zero installation required (you’ll need Java on your computer, but that’s pretty prevalent these days).  Double click on the bat file (or .sh if you’re using linux).

When the product launches you’ll notice a panel that allows you drag and drop elements onto the canvas in an easy to use fashion.  I’m sure additional tutorials will come on this blog and Pentaho.org but suffice to say, this is an interface which is easy enough to just "figure out" by playing with it.

The "RED" circle is our palette and the "BLUE" area is our canvas.

Let’s get going and start our report!

  1. Launch the Report Wizard
  2. Select the option that indicates that you will use your own dataset, a JDBC dataset
  3. Enter in the connection information and driver location for your database.  I keep the latest Oracle Express edition (a Free version of the Oracle database) around.
    Note:  You don’t have to do anything special with the JDBC driver (put it in a lib directory or anything).  All you have to do is show the wizard where the .jar file is.

    I’m using the HR schema which comes with the Oracle database for testing/sample purposes.
  4. Navigate to find the "EMPLOYEES" and "DEPARTMENT" tables.  Enter in a simple SQL query that contains the data of interest and use the very handy Preview Option to make sure you’re getting the results desired.

    Feel free to just copy and paste if you are using XE as well:
    select
    d.department_name "Department Name",
    e.first_name "First Name",
    e.last_name "Last Name",
    e.phone_number "Phone Number"
    from
    employees e, departments d
    order by d.department_name
  5. You can just click Next on the visible feilds screen:
  6. Highlight "Department Name" and add it to the grouping and hit "Finish"
  7. It should return you to the original canvas where you can see the design of your report.  From here you can start to add images, lines, change fonts, etc.  Have fun exploring the richness of the options available here.
  8. Let’s see what it looks like!  Click Preview and page through your report!

That’s it!  You’re done!  You’ve created a report that can be parameterized, hosted, bursted, distributed in just a few minutes.  In a follow on blog I’ll show you how to publish this into the Pentaho server (it’s only about 2 more steps).

Happy Trails!

Trying Qumana

I recently moved to WordPress as a blogging engine.  So far I’ve liked it very much, and the WYSIWYG editor in the web browser is pretty good.  Much better, in my opinion than the web based  Movable Type editor.

That being said, I reall do like being able to blog quickly and efficiently from my desktop.  Screen captures, text, copy and paste URLs, all make blogging feel much more like a treat; a thing you get into the rhythym of instead of taking time out of the day to get things "ready to go."

Now, if I ever decide to go Linux flat out I’ll have to do this all over again I suppose.  Until then, I think I rather like it.

One thing I think is missing from nearly all of these desktop blogging products is the ability to do real copy and paste.  Everything has to already be in a file.  For quick screen captures to blog I’d LOVE for a tool to just accept clipboard data and make it into a file.  Anyone know of any product that does that?

OLAP Survey

I noticed some other bloggers posted but I’ll encourage people as well. The more people that respond the more accurate the survey represents reality!
“We would very much welcome your participation in The OLAP Survey 6. This is the largest independent survey of business intelligence users worldwide. The Survey will obtain input from a large number of users to better understand their buying decisions, the implementation cycle and the business success achieved. Both business and technical respondents are welcome.

The OLAP Survey is strictly independent. While Oracle, Microsoft, Cognos and other vendors assist by inviting users to participate in the Survey, the vendors do not sponsor the survey, nor influence the questionnaire design or survey results. As a participant, you will not only have the opportunity to ensure your experiences are included in the analyses, but you will also receive a summary of the results from the full survey. You will also have a chance of winning one of ten $50 Amazon vouchers. Click here to complete the survey on-line.”