For those that weren’t able to attend the fantastic NoSQL Now Conference in San Jose last week, but are still interested in the slides about how people are doing Ad Hoc analytics on top of NoSQL data systems, here’s my slides from my presentation:
Category Archives: Big Data
Splunk is NoSQL-eee and queryable via SQL
Last week at the Splunk user conference in San Francisco, Paul Sanford from the Splunk SDK team demoed a solution we helped assemble showing easy SQL access to data in Splunk. It was very well received and we look forward to helping Splunk users access their data via SQL and commodity BI tools!
While you won’t find it in their marketing materials, Splunk is a battle hardened, production grade NoSQL system (at least for analytics). They have a massively scalable, distributed compute engine (ie, Map-Reduce-eee) along with free form schema-less type data processing. So, while they don’t necessarily throw their ring into new NoSQL type projects (and let’s be honest, if you’re not Open Source it’d be hard to get selected for a new project) their thousands of customers have been very happy with their ingestion, alerting, and reporting on IT data and is very NoSQL-eee.
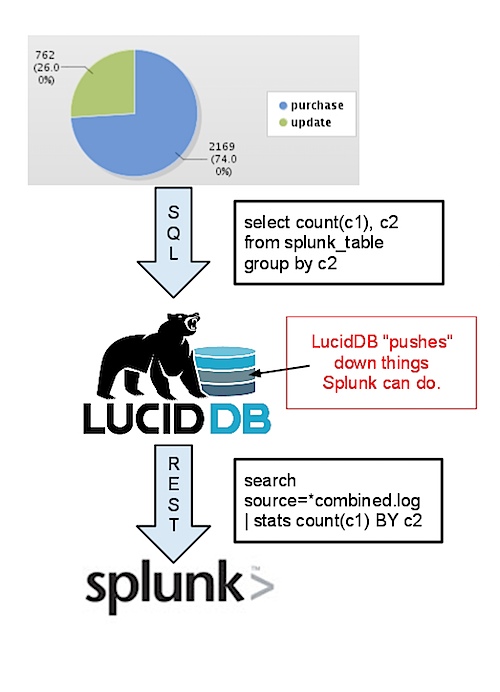
The SDK team has been working on opening up the underlying engine, framework so that additional developers can innovate and do some cool stuff on top of Splunk. Splunk developers from California (some of whom worked at LucidEra prior) kick started a project that gives LucidDB the ability to talk to Splunk hereby enabling SQL access to commodity BI tools. We’ve adopted the project, and built out some examples using Pentaho to show the power of SQL access to Splunk.
First off, our overall approach is similar to our existing ability to talk to CouchDB, Hive/Hadoop, etc remains the same.
- We learn how to speak the remote language (in this case, Spunk search queries) generally. This means we can simply stream data across the wire in it’s entirety and then do all the SQL
- We enable some rewrite rules so that if the remote system (Splunk) knows how to do things (such as simple filtering in the WHERE clause, or GROUP BY stats) we’ll rewrite our query and push more to the work down to the remote system.
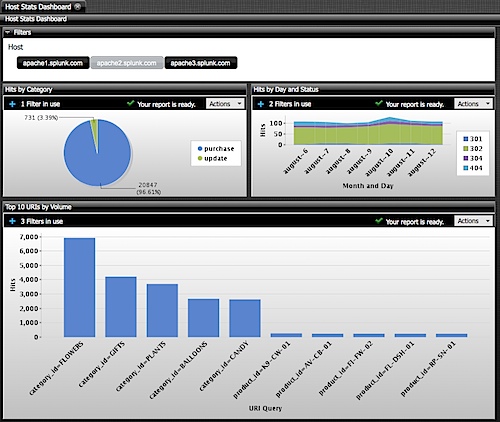
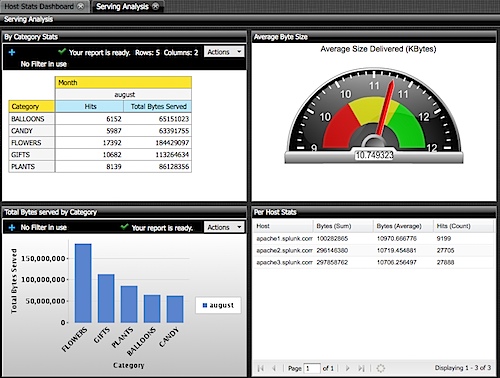
Once we’ve done that, we can enable any BI tool (that can do things such as SQL, read catalogs/tables, enable metadata/etc) connect up and do cool things like drag and drop reports. Here’s some examples created using Pentaho’s Enterprise Edition 4.0 BI Suite (which looks great, btw!):
These dashboards were created, entirely within a Web Browser using Drag and Drop (via Pentaho’s modeling/report building capabilities). Total time to build these dashboards was less than 45 minutes including model definition and report building (caveat: I know Pentaho dashboards inside and out).
Splunk users can now access data in their Splunk system, including matching/mashing it with others simply and easily in everyday, inexpensive BI tools.
In fact, this project came about initially as a Splunk customer wanted to do some advanced visualization in Tableau. Using our experimental ODBC Connectivity the user was able to visualize their Splunk data in Tableau using some of their fantastic visualizations.
Pushdown Query access to Hive/Hadoop data
Just in time for the Hadoop Summit, we’ve updated some pieces of LucidDB to be able to do “more” with the Hive driver. We’ve had the ability to connect and query data inside of Hive for about a year already. The initial implementation allowed people to:
- Use Hive for it’s massive scalability, distributed data processing capabilities.
Hive is great at processing huge amounts of data. It’s scales to hundreds of servers, and has a bunch of fantastic features for structured and semi structured data processing, fault tolerance, etc. Hive is a great way to do heavy lifting sorting through petabytes of data to arrive at some interesting, pre-aggregated datasets. - Cache the output of Hive views into LucidDB.
Now when we’re talking about taking the output of Hive views into LucidDB, we’re not talking about SMALL datasets (10k rows) we’re talking about 50 or 100, or 500 million rows. Some might think that number is small (by Hive standards it often is) and others might think that’s big (our entire DW is only 200 million rows). However, LucidDB has provided the ability to draw in data from Hive via easy MERGE/INSERT statements.
You can see some background on this integration that has been functional since August 2010 on Eigenpedia: http://pub.eigenbase.org/wiki/LucidDbHive
Also, a video I recorded last year showing the basic integration: (THIS IS NOT NEW!!!!).
Why the blog now? We’ve done a couple of things over the past while.
- We’ve done some work on LucidDB (yet to be committed and will be a POST 0.9.4 commit) that allows the use of Hives, well, somewhat unique driver. Hive’s driver has a bunch of quirks in terms of metadata, etc that we’re now recognizing and using properly over in LucidDB.
- We’ve updated to the 0.7.0 release. We’re now ready to go with the latest and great Hive features.
- We’ve enabled some pushdowns to work to allow for easier day to day loading of LucidDB tables from Hive, along with a limited workload of Ad Hoc SQL access.
Our vision for Big Data dictates the need for:
- Live, real time, per query access to the Big Data system that is useful and practical (ie, filters, etc).
This means that you need to be able to allow the user, via simple Parameter or simply by hitting a different schema or table access to the live data.
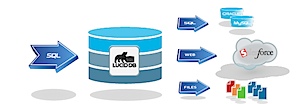
- Easy, full ANSI SQL access to high performance, low latency, aggregated data.
Dashboards need results that come back in seconds, not minutes. LucidDB and the data cached there provide a great “front end” for easily doing real BI work on top of data that sits inside Hive.
We’ve updated our connectors to allow some filtering/projection pushdowns to work with Hive.
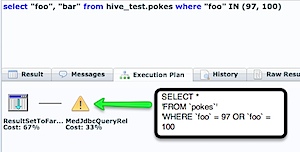
Here’s a simple example. We have a report or dashboard which is looking for only a subset of data in Hive. We want to allow the filtering of data to occur and for Hive to receive the filtering from our OLAP/Dashboard.
By default LucidDB will read the entire table and do all SQL functions over in our
However, pulling over the entire table is really not going to work well for us. This would really be the worst of both worlds; you’d be better off just querying Hive directly. However, luckily we’ve enabled some pushdowns be pushed down to Hive.
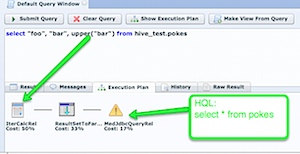
Notice that the condition IN( values ) is being pushed down to the remote Hive server.
Let’s try something a bit more complex!
Currently, we’re able to push down most filters and projections.
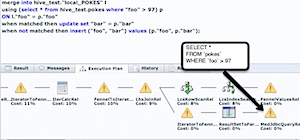
Let’s take now take the use case where we’re trying to ONLY UPDATE records that have been updated since the last time we checked (ID > 97). More likely the key that we’d use to do this push down filter would be a date, but you can simply use your imagination.
Consider the following SQL:
merge into hive_test.”local_POKES” l
using (select * from hive_test.pokes where “foo” > 97)
ON l.”foo” = p.”foo”
when matched then update set “bar” = p.”bar”
when not matched then insert (“foo”, “bar”) values (p.”foo”, p.”bar”);
This SQL is a typical “incremental” load from a remote system. Syntactically a little dense, but it’s actually a VERY high performance method to load directly into LucidDB often eliminating the need entirely to draw the data through an intermediate server and process (ETL Tool).
Our enhancements allow the Hive portion to be pushed down. Hive will ONLY return values greater than 97 and we’ll simply intelligently keep any changed records “up to date” in LucidDB for reporting.
Many of these changes will be in a patched version of LucidDB; we’ll make this patched release available to any customers who want these optimizations available, immediately for use with Hive. Let us know what you think by joining this conversation at the LucidDB forums: Hive Connector Pushdown
In a subsequent blog we’ll cover how to now match up data coming from Hive (or CouchDB) with data in other systems for reporting.
SQL access to CouchDB views : Easy Reporting
Following up on my previous blog about enabling SQL Access to CouchDB Views I thought I’d share what I think the single, biggest advantage is: The ability to connect, run of the mill, commodity BI tools to your big data system.
While the video below doesn’t show a PRPT it does show Pentaho doing Ad Hoc, drag and drop reporting on top of CouchDB with LucidDB in the middle, providing the connectivity and FULL SQL access to CouchDB. Once again, the overview:
BI Tools are commoditized; consider all the great alternatives available inexpensively (either in Open Source for free, Open Core, or even simply proprietary). Regardless of what solution you choose, these tools have fantastic, easy to use capabilities that are very easy for business users to build their own reports. After all, shouldn’t your developers be extending/creating new applications instead of fiddling with what filters your analysts/executives want to see on their dashboard?
Driving the developer out (as much as possible) is one of the best reasons to try and enable your cool, CouchDB views via SQL.
Here I’ll demonstrate, once we’ve connected LucidDB to our CouchDB view, how a BI Tool can:
- Easily see the data, and understand it’s datatypes. Metadata is well understood between SQL databases and BI tools.
- We can easily use a familiar query language, SQL, that allows for aggregation, filtering, and limiting. This gives a huge swath of BI tools the ability to talk to CouchDB.
- We translate the SQL we receive into optimized* RESTful HTTP view requests.
Per a reader suggestion here’s a video showing the solution, as opposed to the screenshots (PS – Let us know what you think about the CouchDB SQL access, or also the Video vs Screenshot approach).
It picks up right after the previous section. Once we have that CouchDB view in LucidDB then Pentaho (or other BI tools) can connect and access, do ad hod reporting like they always have). As a certified database for Pentaho, you can be quite comfortable that Pentaho will work very very well with LucidDB.
PENTAHO does not even KNOW it’s talking to CouchDB -> It has NO idea; Pentaho thinks it’s a database just like any other
Without further delay:
*optimized = we have a few optimizations available to us, that we’ve not yet put into the connector. For instance, the ability to filter to a particular key (where key = XYZ) pushed down, or group_level=*. This will come over time as we enhance the connector. For now, we’re doing very little in terms of pushing down SQL filters/aggregations into the HTTP view. However, your view itself is almost CERTAINLY aggregated and doing this anyhow.
We’re keen on discussing with CouchDB/Hive/other Big Data users about their Ad Hoc and BI needs; please visit the forum thread about the connector.
0.9.4 did not hit the 1 year mark!
Our last LucidDB release was now, just more than 12 months ago on June 16, 2010. We were really really trying to beat the 1 year mark for our 0.9.4 release but we just couldn’t. A tenet of good, open source development is early and often and we need to do better. Since the 0.9.3 release we’ve:
- Built out an entire Web Services infrastructure
- Developed a wicked cool Admin user interface
- Developed cool connectors to Hive, CouchDB
- Built a whole ton of extensions (auto indexing, DDL generation, improved load routines)
- Scriptable functions, and procedures
- Updated our connectors (JDBC, Salesforce, etc)
All in this is a VERY exciting release… I apologize it’s taken this long, but please bear with us. We’ll be release in the next couple of weeks!
SQL access to CouchDB views
Following up on my first post on an alternative, more SQL-eee metadata driven approach to doing BI on Big Data, I’d like to share an example on how we can enable easy reporting on top of BIg Data immediately for CouchDB users. We’re very keen on discussing with CouchDB/Hive/other Big Data users about their Ad Hoc and BI needs; please visit the forum thread about the connector.
We’ve been working with some new potential customers on how to leverage their investment in Big Data (specifically Big Couch provided by the fine folks at Cloudant. In particular, this prospects users are thrilled with their dashboards and analytics that are baked into their application, but they need to be able to enable Ad Hoc, easy analysis on top of their data via a traditional reporting tool. Like any organization, IT is overworked and reports always seem to find their way to close to the back of the priority. Our initiative at this customer is about enabling easy access to their high performance and well tuned/architected CouchDB instance.
I figured I could generalize what we’re doing at this prospect to a more general post, and hope that this post (and the software behind it, namely LucidDB) finds there way into the hands of others that are trying to do Ad Hoc and easy SQL based analytics on top of CouchDB.
First, the overview:
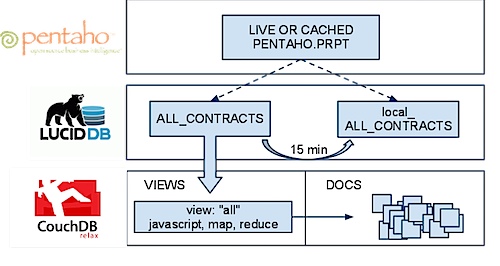
We’ve created a solution that allows HTTP views in CouchDB to be made accessible via SQL inside of LucidDB. This means two things:
- Direct access to LIVE, real time data in CouchDB is available to any tool that can talk to LucidDB (SQL + JDBC/ODBC).
- We can use this access to very easily, keep a cached up to date “cache” of this data in LucidDB, an optimized column storage database. In fact, the periodic refresh is a single MERGE statement (TO BE COVERED IN A SUBSEQUENT BLOG)
Our vision of Big Data BI requires that the user be able to “choose” which version of the data they want, easily. Cached and summarized inside LucidDB -OR- up to date, real time results from Big Data (aka CouchDB). This example focuses on the first part of the “hot or cold” level of aggregation ability; namely the live “HOT” piece.
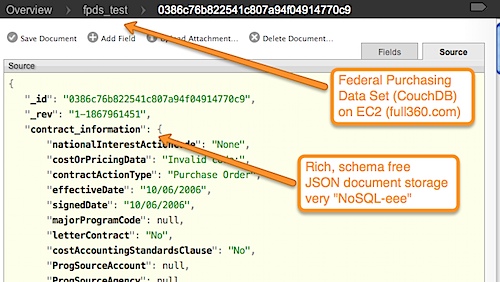
First, let’s look at our source data. We’ve used the Federal Purchasing Dataset (a sample of 1000 records, since this runs on my laptop). Here’s a couple of screenshots from Futon that show the source data docs, and then the CouchDB View.
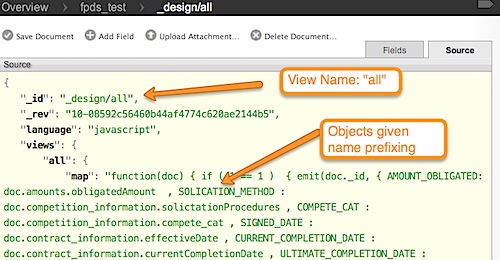
and also the “view” that we’ll access
NOTE: This view is definitely atypical. It is just emitting docs/flattening. it is NOT doing any aggregation with is what is almost always done with HTTP views. Our connector initially supports streaming data from the values, but we’re already working on getting proper support for the KEYs (and ability to push down group_level, etc).
There’s another key piece of our philosophy on Big Data BI that is also present here. Notice that we’re not trying to “dumb down” the source, Big Data system? We’re not trying to strangely Map SQL onto some remote language so that you’ve lost some richness. CouchDB’ers take note: You can do all that you normally can and want to do in that view. We believe in effeciently accessing (group_level optimizations) not about reducing your abilities to write very interesting, complex map / reduce that returns your base level results.
Let’s make these available, via ANSI SQL, in LucidDB.
I’ll start with a vanilla installation of LucidDB (NOTE: I used a pre release version of 0.9.4 for this).
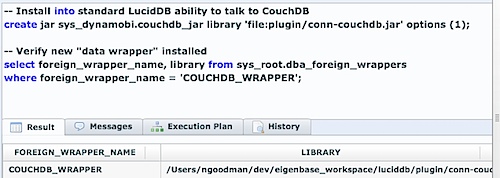
First, let’s give LucidDB the ability, in a general way, to talk to CouchDB as a foreign data source:
Now LucidDB has the ability to talk to CouchDB, in a general sense. Let’s now configure and access our test dataset.
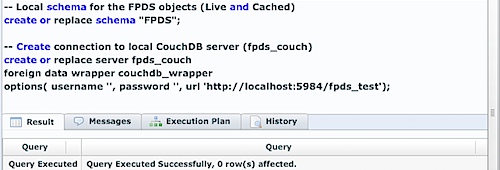
First step is to create a server connection from LucidDB to our CouchDB server:
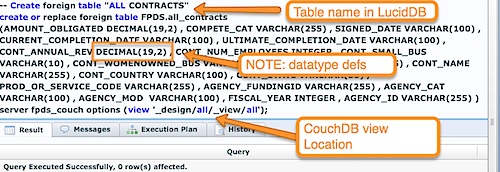
Now, we’ve established a connection from our LucidDB installation to CouchDB; let’s now make that “all” view available via SQL.
That statement looks complicated. It is, unfortunately, a little more involved than this process usually is. If you were talking to say, Oracle database, we can import and “discover” all this information (datatypes, column names, etc) from the driver. We have not done all this additional metadata work for the CouchDB connector yet; or actually, how to get ALL this information from the remote view as well.
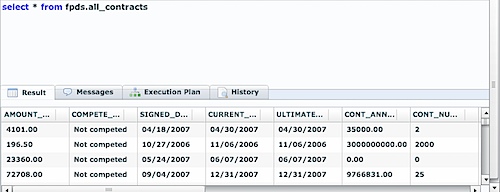
So, we’ve told LucidDB about the server, the view, the datatypes/fields. We’re all set to now do ANY SQL we like on top of it.
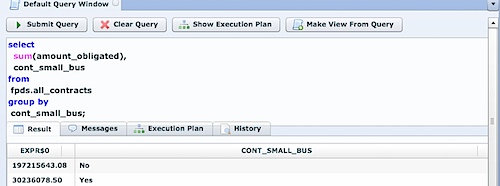
How about doing some aggregations?
We’ll cover creating the “local” cached copy of the CouchDB dataset in the next section.
A different vision for the value of Big Data
UPDATE: Think we’re right? Think we’re wrong? Desperate to figure out a more elegant solution to self service BI on top of CouchDB, Hive, etc? Get in touch, and please let us know!
There’s a ton of swirling about Hadoop, Big Data, and NoSQL. In short, these systems have relaxed the relational model into schema(less/minimal) to do a few things:
- Achieve massive scalability, resiliency and redundancy on commodity hardware for data processing
- Allow for flexible evolution and disparity in content of data, at scale, over time
- Process semi-structured data and algorithms on these (token frequencies, social graphs, etc)
- Provide analytics and insights into customer behaviors using an exploding amount of data now available about customers (application reports, web logs, social networks, etc)
I won’t spend that much more time delving into the specifics of all the reasons that people are going so ape-sh*t over Big Data.
Big Data has a secret though:
It’s just a bunch of technology that propeller heads (I am one myself) sling code with that crunch data to get data into custom built reporting type applications. Unlike SQL databases, they’re NOT ACCESSIBLE to analysts, and reporting tools for easy report authoring and for businesses to quickly and easily write reports.
Until businesses get to ACTUALLY USE Big Data systems (and not via proxy built IT applications) it’s value to the business will be minimal. When businesses get to use Big Data systems directly; there will be dramatic benefit to the business in terms of timeliness, decision making, and insights.
And don’t get me wrong, there’s HUGE value in what these systems can do for APPLICATION developers. Sure sure sure. There’s Hive, and Pig, and all these other pieces but here’s the deal: Not a single set of technology has assembled, from start the finish, the single system needed to quickly and easily build reports on top of these Big Data systems.
It’s starting to get real confusing since vendors see Hadoop/Big Data exactly how they want you to see it:
- If you’re a BI vendor, it’s a new datasource that people can write apps and stream data into your reports.
- If you’re an ETL vendor, it’s a new datasource and you’ll simply make it practical.
- If you’re an EII vendor, it’s a new target for federating queries.
- If you’re an analytic DB vendor, it’s an extension point to do semi-structured or massive log processing.
We have a different vision for doing BI on Big Data; it’s different than the “our product now works with Big Data too” you’ve been told from other vendors:
- Metadata matters: Build a single location/catalog for it!
Where did this report on my dashboard actually come from? When I see this thing called “Average Bid Amount” on my report, which fields back in my NoSQL datastore was that calculated from? Why bother with a separate OLAP modeling tool when you already know your aggregation methods and data types. Current solutions where “it’s just another source” of data that shove summarized Big Data into MySQL databases for reporting miss a huge opportunity for data lineage, management, and understanding. - Summary levels require different “types” of data storage and access
The total number of events can be represented and aggregated to many many different levels of aggregation. Some, very highly summarized figures (such as daily event counts) should be kept in memory and accessible extremely fast for dashboards. Relatively summarized figures (10s of thousands) should be kept in a database. Datamarts (star schemas) that represent some first or second level of aggregation (100m rows) should be kept in a fast column store database. The detail transaction data, and its core processing technologies (M/R, graph analytics, etc) are in the Big Data system. Current solutions provide only tools for data slinging between these levels of aggregation; none provide the ability to access and manage them in a single system. - Inexpensive BI tools allow for cheaper, quicker and better analytic solution development
The “Business Intelligence” industry has been driving the application developer out of the required chain of events for building dashboards/analytic for years. In short, BI is a huge win for companies because it’s cheaper, helps get insights faster, and ultimately allows analysts to be somewhat self sufficient to do their job. Big Data has taken the industry back 10-15 years by making not just complicated reports but literally EVERY report be built by a developer! Current solutions allow for direct connect in reports to Big Data systems but you still have to write programs to access the data. Other solutions simply pull data out of Big Data systems and shove it at MySQL because of this exact reason! - SQL is familiar, well known, and matches with the “easy” data analytics
How easy is it to find and hire someone who can write SQL and build reports (in Crystal/Pentaho/Actuate/etc)? There are literally millions of people that can know SQL. Like it? Who knows. Know it, can use it? MILLIONS! How about hiring someone to build reports who knows the ins and outs of cluster management in Hadoop, knows how to write multi step programs and write application code to push that data into visualization components in the application? 10s of thousands, maybe. And 70% of them right now are in Silicon Valley. Trust me; these skills won’t spread outside of Silicon Valley in great numbers (or at least quickly). - Reporting Only data matters! Make it easy to access/integrate
Simple reporting rollups (say categories of products/web pages, etc) have no place being “pushed” into the Big Data system. Having a system that is doing BI on top of Big Data needs a way to easily, in a metadata driven fashion, match up the Big Data with other reporting only data. Current solutions require complex ETL development and assemble it as part of that stream of data to shove at a MySQL database. - Hot or Cold reporting, let the user choose via SQL
For dashboards the user is almost certainly willing to use the previous load (last hours) data instead of waiting 17minutes to run in the Big Data system. For Ad Hoc analysis reports need to be speed of thought; big data systems can do OK here, but on smaller datasets the best choice is a columnar, high performance BI database (ahem!). For small summaries, or consistently accessed datasets it should be stored in memory. Current solutions require someone building reports to KNOW where the data that they want is, and then connect to an entirely different system (with different query languages such as MDX, SQL, and M/R) to build a report.
We’re building a system, with LucidDB at the center, that is the most complete solution for doing real, day to day, full featured (adhoc, metadata, etc), inexpensive analytics on top of Big Data. Ok, Yawn to that. Since Hadoop and Big Data is hype-du-jour I don’t expect you to believe my bold statements. We’re releasing LucidDB 0.9.4 in the coming weeks, and this core database release will be the infrastructure for the new UI, extensions, and pieces of our solution.

In short DynamoBI’s Big Data solution provides:
- Ability to use inexpensive, commodity BI tools on top of Big Data directly and cached (Pentaho, BIRT, etc). Connect with your existing BI/DW system (via JDBC/ODBC).
- Ability to connect, and make accessible via SQL Big Data systems (currently Hive/HDFS, CouchDB)
- Easily define and schedule incremental updates of local, fast column store caches of data from Big Data systems for Ad Hoc analysis
- Ability to quickly link and include data from other places (Flat File, JDBC, Salesforce, Freebase, etc) with Big Data
- Define aggregations, rollups, and reporting metadata (hierarchies, aggregations, etc)
- Drag and drop reports (via Saiku, Pentaho Analyzer, BIRT)
- Easy, RESTful interaction with the server so our solution fits nicely with your existing systems.
Looking forward to blogging more about it in the coming weeks; if you’re sick and tired of hacking together and spending tons of developer time on building reports on top of Big Data systems please get in touch with us.
