For those that weren’t able to attend the fantastic NoSQL Now Conference in San Jose last week, but are still interested in the slides about how people are doing Ad Hoc analytics on top of NoSQL data systems, here’s my slides from my presentation:
Category Archives: General BI
Splunk is NoSQL-eee and queryable via SQL
Last week at the Splunk user conference in San Francisco, Paul Sanford from the Splunk SDK team demoed a solution we helped assemble showing easy SQL access to data in Splunk. It was very well received and we look forward to helping Splunk users access their data via SQL and commodity BI tools!
While you won’t find it in their marketing materials, Splunk is a battle hardened, production grade NoSQL system (at least for analytics). They have a massively scalable, distributed compute engine (ie, Map-Reduce-eee) along with free form schema-less type data processing. So, while they don’t necessarily throw their ring into new NoSQL type projects (and let’s be honest, if you’re not Open Source it’d be hard to get selected for a new project) their thousands of customers have been very happy with their ingestion, alerting, and reporting on IT data and is very NoSQL-eee.
The SDK team has been working on opening up the underlying engine, framework so that additional developers can innovate and do some cool stuff on top of Splunk. Splunk developers from California (some of whom worked at LucidEra prior) kick started a project that gives LucidDB the ability to talk to Splunk hereby enabling SQL access to commodity BI tools. We’ve adopted the project, and built out some examples using Pentaho to show the power of SQL access to Splunk.
First off, our overall approach is similar to our existing ability to talk to CouchDB, Hive/Hadoop, etc remains the same.
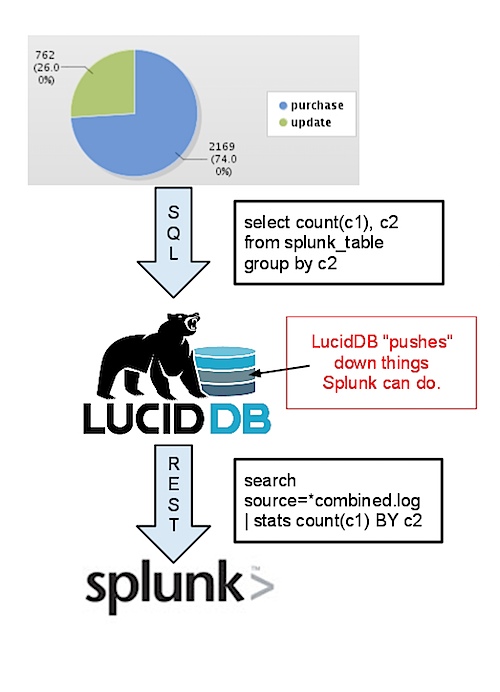
- We learn how to speak the remote language (in this case, Spunk search queries) generally. This means we can simply stream data across the wire in it’s entirety and then do all the SQL
- We enable some rewrite rules so that if the remote system (Splunk) knows how to do things (such as simple filtering in the WHERE clause, or GROUP BY stats) we’ll rewrite our query and push more to the work down to the remote system.
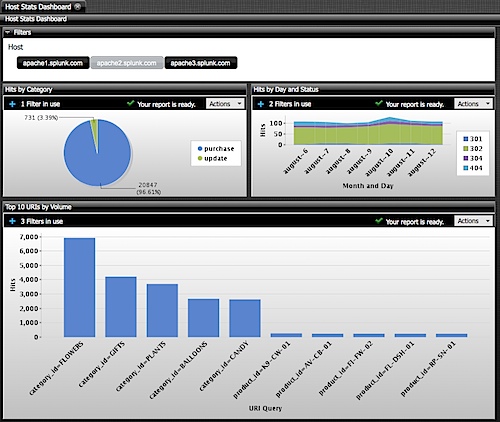
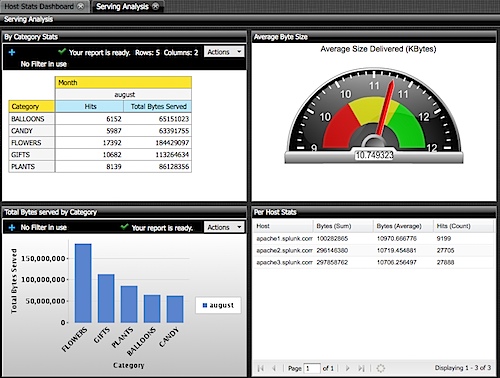
Once we’ve done that, we can enable any BI tool (that can do things such as SQL, read catalogs/tables, enable metadata/etc) connect up and do cool things like drag and drop reports. Here’s some examples created using Pentaho’s Enterprise Edition 4.0 BI Suite (which looks great, btw!):
These dashboards were created, entirely within a Web Browser using Drag and Drop (via Pentaho’s modeling/report building capabilities). Total time to build these dashboards was less than 45 minutes including model definition and report building (caveat: I know Pentaho dashboards inside and out).
Splunk users can now access data in their Splunk system, including matching/mashing it with others simply and easily in everyday, inexpensive BI tools.
In fact, this project came about initially as a Splunk customer wanted to do some advanced visualization in Tableau. Using our experimental ODBC Connectivity the user was able to visualize their Splunk data in Tableau using some of their fantastic visualizations.
Asking this question means you don't get BI market
In almost every technology company, if you’re explaining your business model savvy technology executives ask the question:
Who are you selling this too? What’s his/her title, where does he work? What’s the size of their company?
It’s a question that helps the questioner understand, and the responder clarify exactly who is buying the product. This is critical for a business! Is it the System Administrator manager who is looking for his DBAs to coordinate their efforts (groupware for DBAs)? Is it a CRM system that the business users are primarily evaluating for use (salesforce/sugarcrm) but requires huge IT investment for configuration/integration?? For a software or IT services provider, deciding WHO you sell to (Business Users or IT) is hugely important!
Asking this question when that technology or services is in Business Intelligence is just plain useless though. Business Intelligence is always a mix of the two. IT? Sometimes they’re the ones buying, but never without HUGE amounts of time spent with the business side (casual report developers and business analysts). Business Users buying tableau, and coordinating parts of the purchase or data access with IT? Yup. Analysts embedded with business teams buying SAS/SPSS, through an IT purchasing process? Sure thing.
Business Intelligence is always sold to two groups at once which makes it a tricky thing to sell. Anyone reading this, consider how much tension you’ve observed between your IT/Business groups. Trying to get dead in the middle on this is a tricky proposition.
Business Intelligence sales guy earn their money for sure!
DynamoBI: website? bits?
Well, what a soft launch it has been. 🙂
Some people have asked:
When are you going to get a website? Errr…. Soon! We soft launched a bit early, due to some “leaking information” but figured heck, it’s open source let’s let it all out. Soon enough, I swear!
Where can I download DynamoDB? Errr… you can’t yet cause we haven’t finished our build/QA/certification process.
However, since DynamoDB is the alter ego business suit wearing brother of LucidDB, just download the 0.9.2 release if you want to get a sense of what DynamoDB is.
There are 3 built binaries (Linux 32, Linux 64, and Windows 32): http://sourceforge.net/projects/luciddb/files/luciddb/luciddb-0.9.2/ and you can find installation instructions here.
DynamoDB will have the same core database, etc. So, from a raw feature/function perspective what you download and see with LucidDB will be what you get in DynamoDB. DynamoDB will have an administration UI to make things like setting up foreign servers, managing users, etc easier. And lots of other cool new features on the longer term roadmap, which if when we get a website would be a great place for that to go!
Until then, use the open source project, LucidDB. I think you’ll like it!
OpenSQLCamp 2009 with LucidDB
LucidDB is now a sponsor OpenSQLCamp 2009, courtesy of DynamoBI which doesn’t have its own logo yet! 🙂

I’ll be attending representing the LucidDB camp, since Mr. John Sichi will be running a marathon (1/2?) that weekend. Let me know if you’ll be there!
MDX Humor from Portugal
Pedro Alves, the very talented lead developer behind the Pentaho Community Dashboard Framework gave me a good chuckle with his high opinion of MDX as a language:
MDX is God’s gift to business language; When God created Adam and Eve he just spoke [Humanity].[All Members].Children . That’s how powerful MDX is. And Julian Hyde allowed to use it without being bound to microsoft.
If you haven’t checked out Pedro’s blog, definitely get over there. It’s a recent start but he’s already getting some great stuff posted.
PDI Scale Out Whitepaper
I’ve worked with several customers over the past year helping them scale out their data processing using Pentaho Data Integration. These customers have some big challenges – one customer was expecting 1 billion rows / day to be processed on their ETL environment. Some of these customers were rolling their own solutions; others had very expensive proprietary solutions (Ab Initio I’m pretty sure however they couldn’t say since Ab Initio contracts are bizarre). One thing was common: they all had billions of records, a batch window that remained the same, and software costs that were out of control.
None of these customer specifics are public; they likely won’t be which is difficult for Bayon / Pentaho because sharing these top level metrics would be helpful for anyone using or evaluating PDI. Key questions when evaluating a scale out ETL tool: Does it scale with more nodes? Does it scale with more data?
I figured it was time to share some of my research, and findings on how PDI scales out and this takes the form of a whitepaper. Bayon is please to present this free whitepaper, Pentaho Data Integration : Scaling Out Large Data Volume Processing in the Cloud or on Premise. In the paper we cover a wide range of topics, including results from running transformations with up to 40 nodes and 1.8 billion rows.
Another interesting set of findings in the paper also relates to a very pragmatic approach in my research – I don’t have a spare 200k to simply buy 40 servers to run these tests. I have been using EC2 for quite a while now, and figured it was the perfect environment to see how PDI could scale on the cheapest of cheap servers ($0.10 / hour). Some other interesting metrics, relating to Cloud ETL is the top level benchmark of a utility compute cost of ETL processing of 6 USD per Billion Rows processed with zero long term infrastructure commitments.
Matt Casters, myself, and Lance Walter will also be presenting a free online webinar to go over the top level results, and have a discussion on large data volume processing in the cloud:
High Performance ETL using Cloud- and Cluster-based Deployment
Tuesday, May 26, 2009 2:00 pm
Eastern Daylight Time (GMT -04:00, New York)
If you’re interested in processing lots of data with PDI, or wanting to deploy PDI to the cloud, please register for the webinar or contact me.
select stream REAL_TIME_BI_METRIC from DATA_IN_FLIGHT
SQL is great. There are millions of people who know it, it’s semantics are standardized (well, as much as anything is ever I suppose), and it’s a great language for interacting with data. The folks at SQLstream have taken a core piece of the technology world, and turbocharged it for a whole new application: querying streams of data. You can think of what SQLstream is doing as the ‘calculus’ of SQL – not just query results of static data in databases but query results of a stream of records flowing by.
Let’s consider some of the possibilities. Remember the results aren’t a one time poll – the values will continue to be updated as the query continues.
// Select the stocks Average price over the last 10 ticks
select stream stock, avg(price) over (previous 10) from stock_ticker group by stock
// Get the running averages for the past minute, hour, and day updated
select stream stock, avg(price) over (range interval 1 minute preceding) as “AvgMinute” , avg(price) over (range interval 1 hour preceding) as “AvgHour”, avg(price) over (range interval 1 day preceding) as “AvgDay” from stock_ticker group by stock;
For a variety of reasons, I haven’t posted my demo of my real time BI analytics powered by SQLstream but figured it’s about time to at least talk about it. The demo is illustrative of a the BASIC capabilities of the SQLstream RAMMS (Relational Asynchronous Messaging Management System). Trust me, the simple stream queries I wrote are about as trivial as possible. The more complex the business needs the fancier the SQL becomes, but that’s the point where the demo turns into a real customer project.
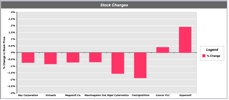
You can’t see it in just the still image below, but the bars in the bar chart are “dancing” around as events are flowing from SQLstream. It’s very very cool to watch a web dashboard update with no interaction. There’s a huge data set of stock prices being INSERTed into a stream via JDBC from one application and there’s a stream select that gives a windowed “% Change” of stock price. The application simply gets the “Stock / % Change” values over JDBC with all the complex windowing, grouping etc being done by SQLstream.
SQLstream have announced the 2.0 release of their product. Some of you may be curious as to where the 1.x version of their product has been. To date, SQLstream hasn’t made much fanfare about their products. They’ve been selling to customers, working with the Eigenbase foundation, and have released several versions of their product over that past few years. I’ve had the chance to work with the 1.x series of their product and an early release candidate of their 2.x series and think it’s very very compelling. I very much look forward to digging into the new 2.x features soon.
In particular, and what I continue to find most fascinating, is the new aggregation features in 2.x. This will allow users of ROLAP type query systems (or simply companies with summary/aggregate tables they spend time updating) to keep these tables up to date throughout the day. This is a huge win for companies that have to update summary tables from huge transaction data sets.
Consider a common problem batch loading window. You load a million records / day. You do period batch updates of your transactions throughout the day and at midnight you kick off the big huge queries to update the “Sales by Day”, “Sales by Month”, “Sales by Qtr”, “Sales by Year”, “Sales All Time” summary tables that take hours to rebuild (going against huge fact tables). Missing the batch window means reports/business is delayed. SQLstream can ease this burden. SQLstream is efficiently calculating these summaries throughout the day (period batch loads) and at midnight simply “spits out” the summary table data. That’s a huge win for customers with a lot of data.
If you’re loading millions of records per day and you need to keep summaries up to date or have time sensitive BI applications you should definitely consider SQLstream. If you’re interested in discussing real time BI or the benefits of streaming aggregation don’t hesitate to contact Bayon ; we can help you prototype, evaluate and build a SQLstream solution
Business Intelligence: Experience vs Sexy
A couple of postings over the past few days that prompted me to put some digital pen to paper so to speak. The first was a post by L. Wayne Johnson who works for Pentaho who I had the pleasure to meet last week in Orlando entitled “Is it just sexy?” The second was by a Ted Cuzzillo over at datadoodle.com entitled “Tableau is the new Mac” Both share important perspectives that deserve some more light.
First, we have to start with a premise that leads you to see why there are two somewhat divergent paths that products/people/companies are taking. BI is now a commodity. The base technology components for doing BI (reports, dashboards, OLAP, ETL, scheduling, etc) is commodotized. Someone once told me that once Microsoft enters and nails a market, you know it’s been commodotized and based on the success of MSAS/DTS/etc you can tell that MSFT entered long ago and nailed it. So, if you don’t believe that the raw technology for turnings data into information is essentially commodotized then you should stop reading now. The rest will be useless to you.
What happens when software becomes a commodity? There’s usually a mid market but you start to see players emerge at two ends of a spectrum.
Commodity End (Windows, Open Office, linux, Crystal Reports):
- Hit the good side of the features curve. Definitely stay on the good side of the 80/20 rule.
- Focus on lots and lots of basic features. You’re trying to appeal to lots and lots of people. If you’re pipe isn’t 1000x bigger than the other market you are toast.
- Provide a “reasonable” quality product. To use a car metaphor, you build an automatic transmission car with manual windows. The lever to open and close the window doesn’t usually fall off and if it does, you’ve already put 100,000 miles on the car.
- Treat the user experience as one category in “Features.” Usability is something you build so that customers don’t choose the other guy over you – it’s not core to your business, you just have to provide enough for them to be successful and not hate your product.
- Sell a LOT of software. Commodity End of a market is about HIGH VOLUME (you should sell at least one or two orders of magnitude more than the experience end) – however, people looking for “reasonable commodity” products are cheap. They want low prices so this also means your MARGINs are lower. Commodity selling is about HIGH VOLUME, LOW MARGIN business. (Caveat: not always true).
Experienced Based (Mac, iPhone, Crystal XCelcius):
- The good side of the 80/20 rule still applies. Experience based doesn’t always mean 100% high end, every bell and whistle.
- Focus on features that matter to the user doing a job. If a feature is needed to help a customer nail a part of their using your product it, add it and make it better than they expect. Lacking features isn’t a bad thing if you keep adding them – for instance the iPhone was LAME feature for feature initially (no GPS, battery was a pain, etc) but users were patient.
- Provide a high quality product that is as much about using as doing. The experienced based product says that it’s not enough to have a product that does what you want, but it has to be something you ENJOY using.
- User and Experience is KING. Usability is not something that is a feature to implement, it’s the thing that informs, prioritizes and determines what features are implemented.
- Sell some software. In order to get the driving experience a user wants (BMW 700x series) they are willing to pay for it. It’s a higher margin business and there’s no secret that if someone is looking for something that both works, and they LOVE to use then it’s worth more to them. It’s a LOWER VOLUME, HIGHER MARGIN business. (Caveat: not always true – things are relative. iPod is higher margin but also high volume).
So… Let’s get back to the point on BI. I’ve built some sexy BI dashboards for customers that look great, including some recent ones based on the Open Flash Chart library. However, I come more from the Data Warehouse side of the house so more of my time is spent on ETL, incremental fact table loads, etc. I understand that you have to have a base of function/feature to have a fighting chance on the experience side.
Sexy isn’t “just sexy” if done right. When done right, Sexy is called “Great Experience.”
Experience is about creating something that people want to use. People are happier with a software product when they enjoy using it. For instance, Ted refers to Tableau as “a radically new product.” I’ve seen it and it’s a GREAT experience, with some GREAT visualization but there’s nothing REVOLUTIONARY about it except for the experience. It’s not in the cloud, it’s not scaling beyond the petabytes, it’s not even a web product (it’s a windows desktop APP). Not revolutionary, just GREAT to use.
Tableau is an up and comer for taking something commoditized (software to turn data into insight) and making it fun to use and leaving users with a desire for more. Kudos to Tableau.
What about on the commodity side – that’s where players like Pentaho come in. They’ve built something that meets a TON of needs for a TON of customers and does so at a VERY VERY compelling price (free on open source side, or subscription for companies). Recall, Pentaho is the software that I use day in and day out to help customers be successful – and they are consistently. Pentaho is earnestly improving their usability that matches up with the philosophy of Usability is a category of features. Sexy is just Sexy for the kind of business and market they are trying to build. They want to make things look nice to be usable and help people do their job well but they’re not going to spend man years on whizbang flash charts. The commodity end is a great business model – Amazon.com is pointed about their business model of “pursuing opportunities with high volume and low margins and succeeding on operational excellence.” I consider Pentaho a bit more revolutionary than Tableau – it’s 100% platform independent and the rate at which open source development clips IS REVOLUTIONARY.
Pentaho is an up and comer for taking something commoditized (software to turn data into insight) and making it easy to obtain, inexpensive to purchase, and feature rich. Kudos to Pentaho.
Both sides of the market are valid. There’s a Dell and an Apple. There’s BMW and Hyundai – both are equally important to the markets they serve and the same is true for BI as a market.
PS – I do agree with L. Wayne Johnson that there can be sexy that is “just sexy.” A whizbang flash dial behind questionable data is pretty lame, or an animation that adds nothing to the data (see this Flash pie chart for an example of a useless sexy animation) The point being that if you consider the “antee” for the BI game at “good data” then the experience/feature sets/approach is what separates the market.
A company that doesn't get "it" – ParAccel homepage
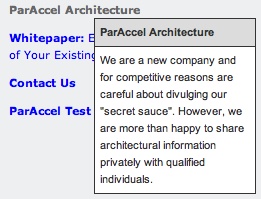
UPDATE: ParAccel have updated their website and no longer have the below silly teaser link.
I ran into someone from ParAccel at a TDWI conference this year and she alluded to the fact that I might find their product interesting. I saw another blog posting that mentioned them so I figured out it was time to go and find some information.
I’m a consultant. I’m not into vague marketing statements like “We scale linearly and process data 100x faster than everyone else.” Everyone has that on a website with a Dashboard or some whizbang graph. What is going to get a company into my sales channel (I have customers)? Good information about their product. What it is. Specs. Diagrams with approach to scaling. Things people like me need to understand what a product is.
So – here’s a dumb move. Put a link on your homepage (http://www.paraccel.com) that invites people to learn about your Architecture but then come up with some self important fake popup about an architecture that is SOOOO secret we can’t even give you a big diagram with bubbles and concepts.
In the day and age where Open Source and user generated content, tips, ideas are progressing technology at impressive rates there are clearly some people who get “it” and don’t. Getting customers jazzed about your product (with that big diagram with bubbles and concepts) is more important than what you think your competitors will gleam from it (big diagram with bubbles and concepts).
Yawn. Moving on. 🙂
