Category Archives: Open Source

DynamoBI: website? bits?

Well, what a soft launch it has been. 🙂

Some people have asked:

When are you going to get a website? Errr…. Soon! We soft launched a bit early, due to some “leaking information” but figured heck, it’s open source let’s let it all out. Soon enough, I swear!

Where can I download DynamoDB? Errr… you can’t yet cause we haven’t finished our build/QA/certification process.

However, since DynamoDB is the alter ego business suit wearing brother of LucidDB, just download the 0.9.2 release if you want to get a sense of what DynamoDB is.

There are 3 built binaries (Linux 32, Linux 64, and Windows 32): http://sourceforge.net/projects/luciddb/files/luciddb/luciddb-0.9.2/ and you can find installation instructions here.

DynamoDB will have the same core database, etc. So, from a raw feature/function perspective what you download and see with LucidDB will be what you get in DynamoDB. DynamoDB will have an administration UI to make things like setting up foreign servers, managing users, etc easier. And lots of other cool new features on the longer term roadmap, which if when we get a website would be a great place for that to go!

Until then, use the open source project, LucidDB. I think you’ll like it!

LucidDB: DynamoBI is running with it

I can think of no better analogy than that of a multi leg race. You know, the races where one sprinter runs as fast as they can, before passing the baton to the next sprinter.

200910240932

First it was Broadbase.
Second it was LucidEra.
Third it was Eigenbase / LucidEra / SQLstream (joint development w/ Eigenbase).

Having purchased commercial rights from LucidEra it’s ours to run with now, alongside Eigenbase and SQLstream.

LucidDB has been described as the “best database no one ever told you about.” That stops today (the telling part, not the best part). Dynamo Business Intelligence Corp will take this great technology to a wider audience and we’ll be telling EVERYONE about it!

Over time, the exceptional features of this open source project will come to light (column store, bit map idxs, drop in java based user plugins, transparent remote JDBC data access, etc). I think it is important to acknowledge how LucidDB arrived to where it is today.

LucidDB is built by smart smart people (people wayyyy smarter than me!). People who’ve written parallel execution engines in Oracle. People who’ve developed Bitmap IDX implementations and helped file those patents. The heritage of LucidDB starts at Broadbase; LucidEra purchased it and brought it to Eigenbase. Eigenbase, and it’s sponsoring companies, have most claim to its current state. Their stewardship and ongoing evolution of the project is a testament to their talents and commitment to open source development. When you pick up LucidDB/DynamoDB and get your first “Ahhhh Cool! 10x Faster than my current database” you have LucidEra/SQLstream/Eigenbase devs to thank. John V. Sichi (lead and main project sponsor), Tai Tran, Julian Hyde, Rushan Chen, Zelaine Fong, Sunny Choi, Steve, Marc, Richard, Hunter, Edan, Damian, Boris, Benny, Stephan, Oscar, …. and the list goes on and on and on. Some of these people will be helping (in small and big ways) with the new company which is great for customers knowing that the people that wrote this stuff will be helping them be successful!

What’s the plan?

  • Open Source.
    Lots of it. Any readers of this blog, or who know me in general, will know I’m a “burn the boats,” open source kind of guy. We’ll be creating some new projects to make using the features/functions already in LucidDB easier. We’ll also be adding new features, which will make their way back into the LucidDB mainline.
  • Commercial in Name Only.
    Mainline DBMS enhancements and development continue, and will continue to be, in LucidDB (Eigenbase). New projects will be available under an OSI approved license. DynamoDB is the prepackaged, assembled, UI included distribution built for customers/evaluators that we’ll offer support on. Should be as easy as we can possibly make it to evaluate, purchase, and use.
  • In Progress.
    We’ve let the announcement ahead of having our website built, or having completed our own DynamoDB QA’ed build. Our open source roots guide us to an “early and often” approach and we’re taking that approach here. Be patient with us as we roll out the business bit by bit over the next few months. Our #1 priority: establish our support/build/qa infrastructure and get an already great piece of software into hands of people who can benefit from it. Hint: If you’ve ever done a star schema on MySQL you need to talk to us!

One thing I am personally looking forward to is getting to work even more extensively with everyone involved at Eigenbase, including the very talented devs at SQLstream (who produce the best real time analytics/integration engine available).

Feel free to join up in taking LucidDB to a whole new level: Download LucidDB and give it a go yourself, since we just released a new version (0.9.2) yesterday! I believe, like others have already mentioned, adding a bit of commercial support behind an already great piece of software is a winning combination!

Drop a line on through to me if you’re interested in getting involved early on (as a charter customer, developer, user, etc). ngoodman at bayontechnologies (with the .COM).

Amazon's Pre Ordering of books sucks!

I pre-ordered a copy of the new, (first, only, best, and original) Pentaho book “Pentaho Solutions” by Roland Bouman and Jos van Dongen two weeks back.  Saw from a tweet that the book was shipping from Amazon.  Cool – had a look at the page.  Sure, they can ship today if I get my order in on time so I know they can ship it.

How about my pre order, which I would assume would go out before regular orders?  Won’t ship until next week?  Delivered by 9/11/2009?  Lesson learned – don’t pre order from Amazon.  🙂

CDF Tutorials

The folks at webdetails have posted their Pentaho Community Dashboard Framework tutorials that look great!  They run you through building CDF dashboards which is usually a crucial, user facing part of any BI implementations.  While much of the work is the ETL/OLAP configuration, tuning, etc on the backend most users think of Pentaho as the dashboard/reports they interact with not the data munching for the Data Warehouse.

These tutorials look great; I’ve implemented more than 20 CDF dashboards at four customers already but I still bought them to learn even more ins and outs.  You should too! No better way to learn something than from the source of the technology which in this case is Pedro and team @ webdetails.

MDX Humor from Portugal

Pedro Alves, the very talented lead developer behind the Pentaho Community Dashboard Framework gave me a good chuckle with his high opinion of MDX as a language:

MDX is God’s gift to business language; When God created Adam and Eve he just spoke [Humanity].[All Members].Children . That’s how powerful MDX is. And Julian Hyde allowed to use it without being bound to microsoft.

If you haven’t checked out Pedro’s blog, definitely get over there. It’s a recent start but he’s already getting some great stuff posted.

PDI Scale Out Whitepaper

I’ve worked with several customers over the past year helping them scale out their data processing using Pentaho Data Integration. These customers have some big challenges – one customer was expecting 1 billion rows / day to be processed on their ETL environment. Some of these customers were rolling their own solutions; others had very expensive proprietary solutions (Ab Initio I’m pretty sure however they couldn’t say since Ab Initio contracts are bizarre). One thing was common: they all had billions of records, a batch window that remained the same, and software costs that were out of control.

None of these customer specifics are public; they likely won’t be which is difficult for Bayon / Pentaho because sharing these top level metrics would be helpful for anyone using or evaluating PDI. Key questions when evaluating a scale out ETL tool: Does it scale with more nodes? Does it scale with more data?

I figured it was time to share some of my research, and findings on how PDI scales out and this takes the form of a whitepaper. Bayon is please to present this free whitepaper, Pentaho Data Integration : Scaling Out Large Data Volume Processing in the Cloud or on Premise. In the paper we cover a wide range of topics, including results from running transformations with up to 40 nodes and 1.8 billion rows.

Another interesting set of findings in the paper also relates to a very pragmatic approach in my research – I don’t have a spare 200k to simply buy 40 servers to run these tests. I have been using EC2 for quite a while now, and figured it was the perfect environment to see how PDI could scale on the cheapest of cheap servers ($0.10 / hour). Some other interesting metrics, relating to Cloud ETL is the top level benchmark of a utility compute cost of ETL processing of 6 USD per Billion Rows processed with zero long term infrastructure commitments.

Matt Casters, myself, and Lance Walter will also be presenting a free online webinar to go over the top level results, and have a discussion on large data volume processing in the cloud:

High Performance ETL using Cloud- and Cluster-based Deployment
Tuesday, May 26, 2009 2:00 pm
Eastern Daylight Time (GMT -04:00, New York)

If you’re interested in processing lots of data with PDI, or wanting to deploy PDI to the cloud, please register for the webinar or contact me.

Pentaho Partner Summit

I’m at the Westin close to the event space for the summit…

I’m around tonight – meeting Bryan Senseman from OpenBI a bit later (730 or 800pm).  Anyone else around and want to meet up for dinner?  Email me ngoodman@ignorethispart.com bayontechnologies.com.

Make Mondrian Dumb

I had a customer recently who had very hierarchical data, with some complicated measures that didn’t aggregate up according to regular ole aggregation rules (sum, min, max, avg, count, distinct count). Now, one can do weighted averages using sql expressions in a Measure Expression these rules were complex and they also were dependent on the other dimension attributes. UGGGGH.

Come to that: their analysts had the pristine, blessed data sets calculated at different rollups (already aggregated to Company Regions). Mondrian though, is often too smart for it’s own good. If it has data in cache, and things it can roll up a measure to a higher level (Company Companies can be rolled up to Regions if it’s a SUM for instance) Mondrian will do that. This is desirable in like 99.9% of cases. Unless, you want to “solve” your cube and just tell Mondrian to read the data from your tables.

I started thinking – since their summary row counts are actually quite small.

  1. What if I could get Mondrian to ignore the cache and always ask the database for the result? I had never tried the “cache=” attribute of a Cube before (it defaults to true and I work with that 99.9% of the world). Seems like setting it to false does the trick. Members are read and cached but the cells aren’t.
  2. What if I could get Mondrian to look to my summary tables for the data instead of aggregating the base fact? That just seems like a standard aggregate table calculation. Configure an aggregate table so Mondrian will read the Company Regions set from the aggregate instead of the fact

Looks like I was getting close to what I wanted. Here’s the dataset I came up with to test:

mysql> select * from fact_base;
+----------+-----------+-----------+
| measure1 | dim_attr1 | dim_attr2 |
+----------+-----------+-----------+
| 1 | Parent | Child1 |
| 1 | Parent | Child2 |
+----------+-----------+-----------+
2 rows in set (0.00 sec)

mysql> select * from agg_fact_base;
+------------+----------+-----------+
| fact_count | measure1 | dim_attr1 |
+------------+----------+-----------+
| 2 | 10 | Parent |
+------------+----------+-----------+
1 row in set (0.03 sec)

mysql>
Here’s the Mondrian schema I came up with:

<Schema name=”Test”>
<Cube name=”TestCube” cache=”false” enabled=”true”>
<Table name=”fact_base”>
<AggName name=”agg_fact_base”>
<AggFactCount column=”fact_count”/>
<AggMeasure name=”[Measures].[Meas1]” column=”measure1″ />
<AggLevel name=”[Dim1].[Attr1]” column=”dim_attr1″ />
</AggName>
</Table>
<Dimension name=”Dim1″>
<Hierarchy hasAll=”true”>
<Level name=”Attr1″ column=”dim_attr1″/>
<Level name=”Attr2″ column=”dim_attr2″/>
</Hierarchy>
</Dimension>
<Measure name=”Meas1″ column=”measure1″ aggregator=”min”>
</Measure>
</Cube>
</Schema>

Notice that the aggregate for Parent in the agg table is “10” and the value if the children are summed would be “2.” 2 means it agged the base table = BAD. 10 means it used the summarized data = GOOD.

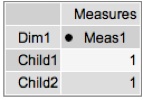
The key piece I wanted to very is that if I start with an MDX for the CHILDREN and THEN request the Parent will I get the correct value. Run a cold cache MDX to get the children values:

200902181235

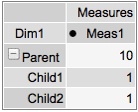
Those look good. Let’s grab the parent level now, and see what data we get:
200902181235-1

The result is 10 = GOOD! I played around with access methods to see if I could get if messed up and on my simple example it didn’t. I‘ll leave it to the comments to point out any potential issues with this approach but it appears as if setting cache=”false” and setting up your aggregate tables properly will cause Mondrian to be a dumb cell reader and simply select out the values you’ve already precomputed. Buyer Beware – you’d have to get REALLY REALLY good agg coverage to handle all the permutations of levels in your Cube. This could be rough – but it does work. 🙂 And caching – it always issues SQL so that might be an issue too.

Sample: cachetest.zip

Mondrian – you’ve been dumbed down! Take that!!!

The death of prevRow = row.clone()

UPDATE: This step is available in Kettle 3.2 M1.

For those that have done more involved Kettle projects you’ll know how valuable the Javascript step is. It’s the Swiss Army knife of Kettle development. The calculator step is a nice thought, but the limited set of functions and the constriction of having to enter it in pulldowns can make more complex calculations more difficult.

Those that have done “observed metric” type calculations in Kettle will know this bit of Javascript well:

var prevRow;
var PREV_ORDER_DATE;

if ( prevRow != null && prevRow.getInteger(“customernumber”, -1) == customernumber.getInteger() )
PREV_ORDER_DATE = prevRow.getDate(“orderdate”, null);
else
PREV_ORDER_DATE = null;

prevRow = row.Clone();

This little bit of Javascript allowed you to “look forward” (or back depending on your sorting) and calculate the difference between items:

  • Watching a set of “balances” fly by and calculate the transactions (this balance – prev balance) = transaction amount
    Web Page duration (next click time – this click time) = time spent viewing this web page
    Order Status time (next order status time – this order status time) = Amount of time spent in this order status (warehouse waiting)

In other words, lining data up and peaking ahead and backwards is a common analytic calculation. In Oracle/ANSI SQL, there’s a whole set of functions that perform these type of functions.

This week I committed to the Kettle 3.2x source code a step to perform the LEAD/LAG functions that I’ve had to hand write several times in Javascript. It’s been long overdue as I told Matt I designed the step in my head two years ago and he’s been patiently waiting for me to get off my *ss and do something about it.

You can find more information about the step on its Wiki page, along with a few examples in the samples/transformations/ directory.

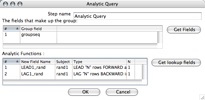
The step allows you peek N rows forward, and N rows backward over a group and grab the value and include it in the current row. The step allows you to set the group (at which to reset the LEAD/LAG), and setup each function (Name, Subject, Type, N rows)
200901301239
Using a group field (groupseq) and LEADing/LAGing ONE row (N = 1) we can get the following dataset:
200901301238
Any additional calculations (such as the difference, etc) can be calculated like any other fields.

This was my first commit to the Kettle project, and a very cool thing happened. I checked in the base step and in true open source fashion, Samatar (another dev) noticed, and created an icon for my step which was great since I had no idea what to make as the icon. Additionally, hours after my first commit he had included a French translation for the step. He and I didn’t discuss it ahead of time, or even know each other. That’s the way open source works… well. 🙂

RIP prevRow = row.clone(). You are dead to me now. Long live the Analytic Query step