Category Archives: Data Integration (Kettle)

PDI Loading into LucidDB

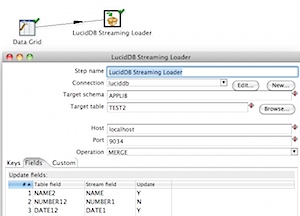
By far, the most popular way for PDI users to load data into LucidDB is to use the PDI Streaming Loader. The streaming loader is a native PDI step that:

  • Enables high performance loading, directly over the network without the need for intermediate IO and shipping of data files.
  • Lets users choose more interesting (from a DW perspective) loading type into tables. In particular, in addition to simple INSERTs it allows for MERGE (aka UPSERT) and also UPDATE. All done, in the same, bulk loader.
  • Enables the metadata for the load to be managed, scheduled, and run in PDI.

201106292256.jpg

However, we’ve had some known issues. In fact, until PDI 4.2 GA and LucidDB 0.9.4 GA it’s pretty problematic unless you run through the process of patching LucidDB outlined on this page: Known Issues.

In some ways, we have to admit, that we released this piece of software too soon. Early and often comes with some risk, and many have felt the pain of some of the issues that have been discovered with the streaming loader.

In some ways, we’ve built an unnatural approach to loading for PDI: PDI wants to PUSH data into a database. LucidDB wants to PULL data from remote sources, with it’s integrated ELT and DML based approach (with connectors to databases, salesforce, etc).   Our streaming loader “fakes” a pull data source, and allows PDI to “push” into it.

There’s mutliple threads involved, when exceptions happen users have received cruddy error messages such as “Broken Pipe” that are unhelpful at best, frustrating at worse. Most all of these contortions will have sorted themselves out and by the time 4.2 GA PDI and 0.9.4 GA of LucidDB are released the streaming loader should be working A-OK. Some users would just assume avoid the patch instructions above and have posed the question: In a general sense, if not the streaming loader how would I load data into LucidDB?

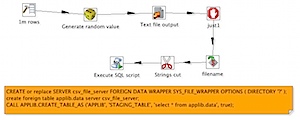
Again, LucidDB likes to “pull” data from remote sources. One of those is CSV files. Here’s a nice, easy, quick (30k r/s on my MacBook) method to load a million rows using PDI and LucidDB:

201106292249.jpg

This transformation outputs to a Text File 1 million rows, waits for that to complete then proceeds to the load that data into a new table in LucidDB. Step by Step the LucidDB statements

— Points LucidDB to the directory with the just generated flat file
— LucidDB has some defaults, and we can “guess” the datatypes by scanning the file
CREATE or replace SERVER csv_file_server FOREIGN DATA WRAPPER SYS_FILE_WRAPPER OPTIONS ( DIRECTORY ‘?’ );
— Let’s create a foreign table for the data file (“DATA.txt”) that was output by PDI
>create foreign table applib.data server csv_file_server;
— Create a staging, and load the data from the flat file (select * from applib.data)
CALL APPLIB.CREATE_TABLE_AS (‘APPLIB’, ‘STAGING_TABLE’, ‘select * from applib.data’, true);

We hope to have the streaming loader ready to go in 0.9.4 (LucidDB) and 4.2 (PDI). Until then, consider this easy, straight forward method of loading data that’s high performance, proven, and stable for loading data from PDI into LucidDB.

Example file: csv_luciddb_load.ktr

Encrypt PDI passwords

PDI has a basic obfuscation method for making it difficult for casual people to lift passwords for DB connections. I have customers that maintain different versions of a “shared.xml” file that maintain different physical connections to databases (think development, QA/testing, and production).

In order to generate the different shared.xml, a user has to usually (per Matt Casters comment below there is a utility that allows user to do this outside of Spoon) open up PDI, created the connections, save them, and then sometimes copy and paste the sections needed to create their “dev” version of shared.xml or their “production” version of shared.xml. Many times this just to generate the password, as they can hand edit the other pieces (hostname, schema, etc).

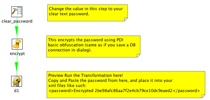
I just committed a quick little PDI transformation that gives you the PDI encrypted form of a password.

201001291332

Happy Password Encrypting!

PDI Scale Out Whitepaper

I’ve worked with several customers over the past year helping them scale out their data processing using Pentaho Data Integration. These customers have some big challenges – one customer was expecting 1 billion rows / day to be processed on their ETL environment. Some of these customers were rolling their own solutions; others had very expensive proprietary solutions (Ab Initio I’m pretty sure however they couldn’t say since Ab Initio contracts are bizarre). One thing was common: they all had billions of records, a batch window that remained the same, and software costs that were out of control.

None of these customer specifics are public; they likely won’t be which is difficult for Bayon / Pentaho because sharing these top level metrics would be helpful for anyone using or evaluating PDI. Key questions when evaluating a scale out ETL tool: Does it scale with more nodes? Does it scale with more data?

I figured it was time to share some of my research, and findings on how PDI scales out and this takes the form of a whitepaper. Bayon is please to present this free whitepaper, Pentaho Data Integration : Scaling Out Large Data Volume Processing in the Cloud or on Premise. In the paper we cover a wide range of topics, including results from running transformations with up to 40 nodes and 1.8 billion rows.

Another interesting set of findings in the paper also relates to a very pragmatic approach in my research – I don’t have a spare 200k to simply buy 40 servers to run these tests. I have been using EC2 for quite a while now, and figured it was the perfect environment to see how PDI could scale on the cheapest of cheap servers ($0.10 / hour). Some other interesting metrics, relating to Cloud ETL is the top level benchmark of a utility compute cost of ETL processing of 6 USD per Billion Rows processed with zero long term infrastructure commitments.

Matt Casters, myself, and Lance Walter will also be presenting a free online webinar to go over the top level results, and have a discussion on large data volume processing in the cloud:

High Performance ETL using Cloud- and Cluster-based Deployment
Tuesday, May 26, 2009 2:00 pm
Eastern Daylight Time (GMT -04:00, New York)

If you’re interested in processing lots of data with PDI, or wanting to deploy PDI to the cloud, please register for the webinar or contact me.

Self Service Data Export using Pentaho

Every BI installation has power users that just want “data dumps.” They may need the dumps for a variety of reasons:

  • You’ve built crappy reports. They can’t get the information they need in *YOUR* reports.
  • They need to feed the data into another system. They want to select all customers who bought product X in time period Y to send them a recall notice. Need a dump of email / addresses to send them the notice.
  • They are addicted to Excel; they feel like a super hero whizzing through the data making fancy graphs and doing a few of their own ratios/calculations.
  • They want to munge the numbers. They will export it to Excel, throw out the data that makes them look bad, and then present it to their boss with shiny positive results.

I had a customer who needed something to “feed the data to another system.” Their original approach was to write a Pentaho Report that formatted to CSV well, write the parameterized query, and then simply generate the report and return it in the browser. This seems like a sound approach and would have been my first as well. They found that it did work well, to a point. It looked as if the Pentaho Report layer tends to use a bunch of memory for report generation – this is understandable. The report object is being rendered but is only “returned” to Pentaho when it’s complete. The entire dataset must be in memory. Well, needless to say, with this customers heap configuration they found a row threshold (30,000) that caused their Pentaho 1.6 installation to croak.

However, they didn’t really need to be using Pentaho Reporting. Kettle, which is included in Pentaho BI Suite has an straightforward performant way to export to CSV. If we could generate that file, and then simply return the file that we just generated to the browser we’d have an elegant solution for data export.

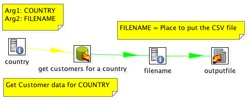
The first piece of the puzzle is the data export KTR. This KTR takes two arguments: Country and Filename. The Country is the value that will limit the data set that we are outputing (output customers in Italy). The Filename is the location to put the file. This isn’t necessary, but it allows the FILENAME to be set by the caller (.xaction) instead of callee (ktr). It’s for convenience.

200902090955

I’ve created a directory in tomcat/webapps/ named “lz”, short for landing zone. This /lz/ directory is accessible via the web browser. By placing this in this location we can use the same tomcat server that is hosting Pentaho to serve up our data export file as well.

Now, let’s get to a little bit of the magic of the Action Sequence, data_export.xaction.
200902091000

The first thing this action sequence does is to create a list of countries, and then prompt the user to select one. This is pretty standard stuff, done all the time with Pentaho reports so we won’t cover the specifics here.

Once we’ve got our “country” defined, we call our “Pentaho Data Integration” KTR component with two arguments. The first is the country the user has just selected and the second is the filename that we’ve hard coded as an input to our action sequence. The filename is the location on the local filesystem you would like kettle to generate the file at (ie, /apps/pentaho/tomcat/webapps/lz/data_export_file.csv).

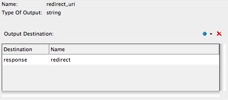
Once we’ve generated the file in that location, we’ll send a redirect to the user as the “output” of this action sequence. The user doesn’t really “see” this; the user will just see the .csv arrive in their browser. The way to get the redirect to work is to add the output to “response.redirect” like so:
200902091005
The redirect URI is another hard coded value: /lz/data_export_file.csv which should reference the path of the file on the web server.

The user experience is indistinguishable from standard reports. User is prompted:

200902091010

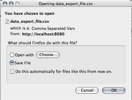
they click “OK” and are prompted what do do with their export.
200902091011

The performance of this solution far surpasses using Pentaho Reporting. Exports of 10,000 rows that were taking 30-60 seconds were taking 10-15 seconds. However, be warned. The export via Kettle will only have as many formatting options as are present in the “Text File Output” step which are many, but limited. If you need fine control over the format of your data export, you may have to stick with Pentaho Reporting since it does provide a superior set of layout/formatting controls.
It should also be noted that this works with zipped files (to zip up the .csv), and also .XLS exports. I’ve provided this sample (data_export.zip) that works with Pentaho 2.0 BI (Needs hypersonic sample database). You’ll have to adjust the “filename” variable to your filesystem before running it for it to work properly (it has the location of my installation).

The death of prevRow = row.clone()

UPDATE: This step is available in Kettle 3.2 M1.

For those that have done more involved Kettle projects you’ll know how valuable the Javascript step is. It’s the Swiss Army knife of Kettle development. The calculator step is a nice thought, but the limited set of functions and the constriction of having to enter it in pulldowns can make more complex calculations more difficult.

Those that have done “observed metric” type calculations in Kettle will know this bit of Javascript well:

var prevRow;
var PREV_ORDER_DATE;

if ( prevRow != null && prevRow.getInteger(“customernumber”, -1) == customernumber.getInteger() )
PREV_ORDER_DATE = prevRow.getDate(“orderdate”, null);
else
PREV_ORDER_DATE = null;

prevRow = row.Clone();

This little bit of Javascript allowed you to “look forward” (or back depending on your sorting) and calculate the difference between items:

  • Watching a set of “balances” fly by and calculate the transactions (this balance – prev balance) = transaction amount
    Web Page duration (next click time – this click time) = time spent viewing this web page
    Order Status time (next order status time – this order status time) = Amount of time spent in this order status (warehouse waiting)

In other words, lining data up and peaking ahead and backwards is a common analytic calculation. In Oracle/ANSI SQL, there’s a whole set of functions that perform these type of functions.

This week I committed to the Kettle 3.2x source code a step to perform the LEAD/LAG functions that I’ve had to hand write several times in Javascript. It’s been long overdue as I told Matt I designed the step in my head two years ago and he’s been patiently waiting for me to get off my *ss and do something about it.

You can find more information about the step on its Wiki page, along with a few examples in the samples/transformations/ directory.

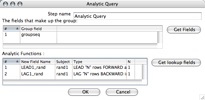
The step allows you peek N rows forward, and N rows backward over a group and grab the value and include it in the current row. The step allows you to set the group (at which to reset the LEAD/LAG), and setup each function (Name, Subject, Type, N rows)
200901301239
Using a group field (groupseq) and LEADing/LAGing ONE row (N = 1) we can get the following dataset:
200901301238
Any additional calculations (such as the difference, etc) can be calculated like any other fields.

This was my first commit to the Kettle project, and a very cool thing happened. I checked in the base step and in true open source fashion, Samatar (another dev) noticed, and created an icon for my step which was great since I had no idea what to make as the icon. Additionally, hours after my first commit he had included a French translation for the step. He and I didn’t discuss it ahead of time, or even know each other. That’s the way open source works… well. 🙂

RIP prevRow = row.clone(). You are dead to me now. Long live the Analytic Query step

Happy New Year 2009!

I resisted the urge to post a “2008 recap” and “2009 predictions” since that seemed to be well covered in lots of different circles/blogs.

Ahhh… Who am I kidding? I’m just lazy! 2008 was a crappy year (personally, but not professionally) and 2009 is off to a great start (personally, but not professionally)!

Already I’m very much enjoying 2009 even though the consulting work is shaping up pretty light these first few weeks.

<shamelessplug>
Need any help with Mondrian/Kettle/Pentaho? I’m available for smaller 3-20 day engagements remotely and onsite in North America.
</shamelessplug>

The best part about the start of the year, was I was able to get some time testing, updating, and deploying to my demo server the two projects that Bayon has been sponsoring over the past few months.

JDBCKettle – Allows for Kettle transformations to be used in an EII fashion. This allows you to use a (set of) kettle transformations and access via SQL.

PentahoFlashCharts – Updated to OFC 2.0 and Pentaho 2.0.stable it also includes new XML Template for building charts. Right now it’s diverged from the Pentaho chart standard but I hope to get back to the standard pentaho chart definition before this goes to an initial Beta release.

I’ll be blogging more about these projects in the coming days.

Happy New Year!

Ordered Rows in Kettle

There was a question posed the other day on the Pentaho forums about how to get Kettle to process “all the rows” at one step before beginning execution on the others. Sven suggested to use the “execute once for every row” as a solution which I think is probably overall, a cleaner way to accomplish a multistep process. However, it is possible to do this in Kettle now.

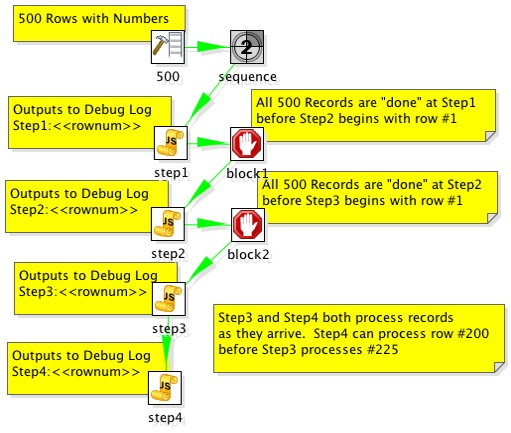
The solution is to add “Blocking Step”s in your transformation where you need the whole thing to have completed before continuing processing.

Consider the following example:

200806251534

The step “block1” does not pass rows to Step2 until all rows have finished at Step1. This accomplishes the desired outcome of ensuring that all records have completed processing on step1 before step2 processes. The example transformation outputs to the debug log and it’s clear that they are output in the correct order.

2008/06/25 15:25:04 - step1.0 - Step1:1
2008/06/25 15:25:04 - step1.0 - Step1:2
2008/06/25 15:25:04 - step1.0 - Step1:3
2008/06/25 15:25:04 - step1.0 - Step1:4
2008/06/25 15:25:04 - step1.0 - Step1:5
...
2008/06/25 15:25:05 - step1.0 - Step1:499
2008/06/25 15:25:05 - step1.0 - Step1:500
...
2008/06/25 15:25:05 - step2.0 - Step2:1
2008/06/25 15:25:05 - step2.0 - Step2:2
2008/06/25 15:25:05 - step2.0 - Step2:3
2008/06/25 15:25:05 - step2.0 - Step2:4
2008/06/25 15:25:05 - step2.0 - Step2:5
...
2008/06/25 15:25:05 - step2.0 - Step2:499
2008/06/25 15:25:05 - step2.0 - Step2:500
...
2008/06/25 15:25:05 - step3.0 - Step3:1
2008/06/25 15:25:05 - step3.0 - Step3:2
2008/06/25 15:25:05 - step3.0 - Step3:3
2008/06/25 15:25:05 - step3.0 - Step3:4
2008/06/25 15:25:05 - step3.0 - Step3:5
2008/06/25 15:25:05 - step3.0 - Step3:6
2008/06/25 15:25:05 - step3.0 - Step3:7
2008/06/25 15:25:05 - step4.0 - Step4:1
2008/06/25 15:25:05 - step3.0 - Step3:8
2008/06/25 15:25:05 - step4.0 - Step4:2
2008/06/25 15:25:05 - step3.0 - Step3:9
2008/06/25 15:25:05 - step4.0 - Step4:3
2008/06/25 15:25:05 - step4.0 - Step4:4

Example here: ordered_rows_example.ktr

Using Kettle for EII

Pentaho Data Integration (aka Kettle) can be used for ETL but it can also be used in EII scenarios. For instance, you have a report that can be run from a customer service application that will allow the customer service agent to see the current issues/calls up to the minute (CRM database) but also give a strategic snapshot of the customer from the customer profitability and value data mart (data warehouse). You’d like to look a this on the same report that with data coming from two different systems with different Operating Systems and databases.

Kettle can make short work of this using the integration Pentaho provides and the ability to SLURP data from an ETL transform into a report without the need to persist to some temporary or staging table. The thing that Pentaho has NOT made short work of, is being able to use the visual report authoring tools (Report Designer and Report Design Wizard) to be able to use a Kettle transform as a source for the report during design time. That’s an important point worth repeating.

As of Pentaho 1.6, Pentaho provides EII functionality at RUNTIME but NOT at DESIGNTIME.

So, you can use an ETL transform as the source of a report, and there two examples of that. In the samples/etl directory that ships in the Pentaho BI Suite demo or you can see another example in an earlier blog entitled “Simple Chart from CSV“.

What is the best method for building reports that are going to use this functionality?

I, like others who use the Pentaho product suite, would like to use the Report Designer to build my report visually but have the data actually coming from an EII transformation. This blog is about those steps.

Step 1. Create your data set

Build an ETL transformation that ends with the data you want to get on your report. Use several databases, lookups, calculations, excel files, whatever you want. Just get your data ready (use the Preview functionality in Kettle). You’d do this with Kettle 2.5.x if you want to deploy into Pentaho 1.6. I’ve created a simple ETL transformation that does something absurdly simple: generate summary sales figures by product.
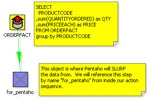
200708151622
Step 2. Add a table output step to the transformation

What we’re going to do now is create a table that we’ll use ONLY during design time to build our report. Just use any database that you have access to while designing the report (MySQL or Oracle XE on your local machine?). Add a table output step to the transformation and click on the “SQL” button to have it generate the DDL for the table. Go ahead and execute the DDL to create your temporary table that we’ll use for designing our report. Name the table something silly like MYTEMPTABLE.
200708151624
200708151627

Step 3. Execute the mapping and populate the temporary table

Hit run and get data into that table. Now we have a table, MYTEMPTABLE that has the format and a snapshot of data we want to use for building our report.

Step 4. Write your report using the temporary table as a source

Open up Report Designer. Run through the wizard (or the Report Designer) as usual and build your report (with groupings, logos, images, totals, etc) just like you normally would. You will use the MYTEMPTABLE in your temporary database as your source for this report.
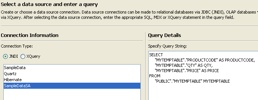
200708151631

Nothing spectacular yet. All we’ve done is write a basic report against a basic table.

Step 5. Publish your report to Pentaho server and test

Using Publish (or Publish to Server) in the Pentaho Report Designer publish the report to the server so you can execute your report from the web using Pentaho. In this example I published the report to samples/etl so it’s alongside the example that we shipped with Pentaho demo server.
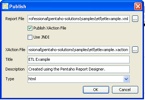
200708151634

Let’s make sure that report showed up.
200708151635

Great. Let’s click on it to make sure the report runs.
200708151636

Ok. Our report (etlexample.xaction) runs inside of Pentaho. Again, at this point we’ve not done anything spectacular this is just a basic (read Ugly basic grey/white) report that just selects data from MYTEMPTABLE.

Step 6. Copy transformation so it’s beside the report

It’s not REQUIRED but it’s a very good idea to DISABLE the hop from the for_pentaho step and the table output. When we run this report now we don’t actually want to do any INSERTS into a table. If we disable the hop after for_pentaho then the transformation does ZERO DML.

The ETL transformation can really be anywhere, but it’s good practice to put the transformation (.ktr file) alongside the report. Copy the kettleexample.ktr file (from Step 1) to samples/etl so that it is sitting alongside etlexample.xaction.

Step 7. Swap from Relational to Pentaho Data Integration.

You could make the change directly to the .xaction to get it to source data from the Kettle transform. However, I’m going to copy etlexample.xaction to etlexample2.xaction just so that I can see both running side by side.

In Design Studio, copy etlexample.xaction to a new action sequence etlexample2.xaction.

Open up etlexample2.xaction and make the following changes.

First, change the name of the action sequence from ETL Transformation to ETL Transformation – NO TABLE
200708151647

Second, remove the “relational” data that is producing the data for the report by highlighting the step named “rule” and then hitting the RED X to remove it.
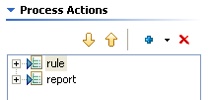
200708151649
Third, add a Get Data From Pentaho Data Integration step ABOVE the report step.
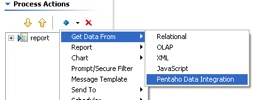
200708151651

Fourth, configure the Pentaho Data Integration as follows.
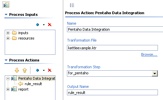
200708151650

Some notes about what we’ve just done there. We’ve told it the name of the Kettle transformation we’d like to use to get our data is kettleexample.ktr. There are two other important pieces of information we’ve filled in on that screen as well. We’ve told the component that we’ll get our data (rows) from the step named “for_pentaho.” The component will SLURP data from that step and stream it into the result. The other piece of information we’ve given to the component is what we want to name the result set so that the report knows where to get the results. Name the result set “rule_result.”

Finally, highlight the report step and make sure that the report is getting its data from “rule_result” but we shouldn’t have to change anything else about the report. Just where it was getting its data.
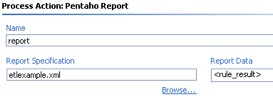
200708151658

Step 8. Test your EII version of your same report

Navigate to find your new report you created that uses the Kettle ETL transformation INSTEAD of the table.
200708151658-1

Click on ETL Example – NO TABLE and you should see the same data/report.
200708151659

This report is NOT using MYTEMPTABLE and is instead, peering inside of kettleexample.ktr and getting its data from “for_pentaho” and generating the report.

Congratulations! You now have a method that you can use to create EII reports using the same visual tools as when normally developing against a relational source. Imagine the possibilities…. what you can do in Kettle (pivot, unpivot, lookup, calculate, javascript, excel, flat file, web service, XML streaming, call database procedures, and on and on and on) you can do for your reports.

Feedback welcome. The zip file for this example here. I built this example on 1.2 Demo Server GA but should work on 1.6 as well. All you need to do is unzip the file above into pentaho-demo/pentaho-solutions/samples/etl and you should have another working example.
Kettles secret in-memory database

Kettles secret in-memory database is

  1. Not actually secret
  2. Not actually Kettles

There. I said it, and I feel much better. 🙂

In most circumstances, Kettle is used in conjunction with a database. You are typically doing something with a database: INSERTs, UPDATEs, DELETEs, UPSERTs, DIMENSION UPDATEs, etc. While I do know of some people that are using Kettle without a database (think log munching and summarization) a database is something that a Kettle developer almost always has at their disposal.

Sometimes there isn’t a database. Sometimes you don’t want the slowdown of persistence in a database. Sometimes you just want Kettle to just have an in memory blackboard across transformations. Sometimes you want to ship an example to a customer using database operations but don’t want to fuss with database install, dump files, etc.

Kettle ships with a Hypersonic driver, and therefore, has the ability to create an in memory database that does (most) everything you need database wise.

For instance, I’ve created two sample transformations that use this in-memory database.

The first one, kettle_inprocess_database.ktr, loads data into a simple table:
200706202230

The second one, kettle_inprocess_database_read.ktr, reads the data back from that simple table:
200706202235

To setup the database used in both of these transformations, which has no files, and is only valid for the length of the JVM I’ve used the following Kettle database connection setup.

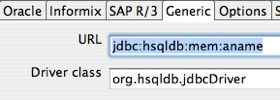
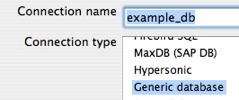
I setup a connection named example_db using the Generic option. This is so that I have full control over the JDBC URL.
200706202227

I then head to the Generic tab and input by URL and Driver. Nothing special with the driver class, org.hsqldb.jdbcDriver that is just the regular HSQLDB driver name. The URL is a little different then usual. The URL provided tells hypersonic to use a database in-memory with no persistence, and no data fil.e”
200706202225

Ok, that means the database “example_db” should be setup for the transformations.

Remember, there is NOTHING persistent about this database. That means, every time I start Kettle the database will have no tables, no rows, no nothing. Some steps to run through this example.

  1. Open kettle_inprocess_database. “Test” the example_db connection to ensure that I / you have setup the in-memory database correctly.
  2. Remember, nothing in the database so we have to create our table. In the testing table operator, hit the SQL Button at the bottom of the editor to generate the DDL for this smple table.
  3. Run kettle_inprocess_database and verify that it loaded 10 rows into testingtable.
  4. Run kettle_inprocess_database_read and verify that it is reading 10 rows from the in-memory table testingtable.

I should note that using this approach isn’t always a good idea. In particular there’s issues with memory management, thread safety, it definitely won’t work with Kettles clustering features. However, it’s a simple easy solution for some circumstances. Your mileage may vary but ENJOY!

Kettle ETL Jobs over the Internet

Kettle recently switched over from accessing the file system via standard Java libraries to using the Apache VFS libraries. So what does that mean? Why does that matter? Well, it really opens up a whole slew of deployment options, and provides even more options for managing Kettle code. You can now manage your actual ETL jobs and transforms in Zipfiles, on Web Servers, FTP servers, WebDav locations, etc. Basically, you can making Kettle even thinner than it is right now.

For instance, you can now run Kettle ETL jobs with ONLY the base Kettle installation and a remote URL. Consider the following example.
I have two Kettle jobs:

http://www.nicholasgoodman.com/kettle/parentjob.kjb
200705281727

-AND –

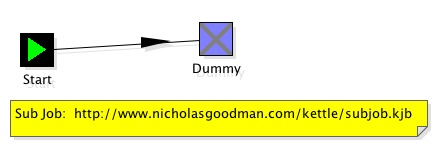
http://www.nicholasgoodman.com/kettle/subjob.kjb
200705281729

The parent job, does something very simple: It executes the subjob.kjb using relative addressing. You can use the well known and supported ${Internal.Job.Filename.Directory} variable so that you don’t have to hard code the physical location of another jobs/transform/datafile/etc. In this case, it doesn’t matter if the subjob is on the local file system or on a webserver. The dialog to setup the relative addressing looks like this:

200705281733

Now, using nothing but the standard Kettle 2.5.0 download I can execute these two jobs without any client side ETL Jobs or Transforms.

./kitchen.sh -file=http://www.nicholasgoodman.com/kettle/parentjob.kjb

17:42:30,075 INFO [Kitchen] Kitchen – Start of run.
17:42:30,644 INFO [Kettle] Kettle – Reading repositories XML file: /Users/ngoodman/.kettle/repositories.xml
17:42:30,647 ERROR [Kettle] Kettle – Error opening file: /Users/ngoodman/.kettle/repositories.xml : java.io.FileNotFoundException: /Users/ngoodman/.kettle/repositories.xml (No such file or directory)
ERROR: No repositories defined on this system.
2007/05/28 17:42:30:695 PDT [INFO] DefaultFileReplicator – Using “/tmp/vfs_cache” as temporary files store.
17:42:31,991 INFO [Thread[parentjob (parentjob (Thread-2)),5,main]] Thread[parentjob (parentjob (Thread-2)),5,main] – Sleeping: 0 minutes
17:42:31,992 INFO [parentjob] parentjob – Starting entry [subjob]
17:42:32,133 INFO [Thread[subjob (subjob (Thread-3)),5,main]] Thread[subjob (subjob (Thread-3)),5,main] – Sleeping: 0 minutes
17:42:32,134 INFO [subjob] subjob – Starting entry [Dummy]
17:42:32,135 INFO [subjob] subjob – Finished jobentry [Dummy] (result=true)
17:42:32,233 INFO [parentjob] parentjob – Starting entry [Dummy]
17:42:32,234 INFO [parentjob] parentjob – Finished jobentry [Dummy] (result=true)
17:42:32,234 INFO [parentjob] parentjob – Finished jobentry [subjob] (result=true)
17:42:32,235 INFO [Kitchen] Kitchen – Finished!
17:42:32,235 INFO [Kitchen] Kitchen – Start=2007/05/28 17:42:30.630, Stop=2007/05/28 17:42:32.235
17:42:32,235 INFO [Kitchen] Kitchen – Processing ended after 1 seconds.

Just another nice feature that allows even more interesting ways to manage a deployment of ETL jobs and Transforms. Great work Kettle team!