Category Archives: Pentaho

Software Quality Reports for Jira 0.8.25

We’ve just released a beta cut of the Software Quality Solution for Jira.  This project, sponsored by Pentaho is a complete BI solution that reports on Jira issue data that runs on top of Pentaho.

Software Quality Reports for Jira is an analytic application; it provides classic slicing and dicing of issue data, along with helpful trend lines, custom reports, etc.  Jira does a GREAT job at operational reporting (what is assigned to me) but isn’t setup to do adhoc, complex, time series and historical reporting.  Things such as bug burndown, average days to close by product and priority, trend lines on bug balances, etc.

Here are some graphs that come “out” of the solution using the web based end user tool:


NOTE: These are reports built from the Jira installation Pentaho uses to track issues for our products, http://jira.pentaho.org:8080 a couple of days back.

This beta release is the first public release of the solution.  We’ve had a customer using the solution, and we’ve been using it against our Jira data now for several months.  In fact, we actually wrote the Jira build PRIOR to the Bugzilla build.

At this point, the primary goal is to collect feedback and set direction to make it more useful.

  • What do you think?  Is it useful?
  • Is it worth the additional installation (Pentaho server) for reporting above and beyond reports in Jira?
  • What do you want to see next?  Dashboards, more reports, additional attributes on the Person dimension, etc?

Feedback here is fine, or email through to me ngoodman __ pentaho  — ORG.

Hope you find it useful!

Turn Pentaho demo into a "server"

The standard Pentaho demo download is super quick and easy: there’s no installation and it just works.  You double click start-pentaho.bat and then it’s running in http://localhost:8080.

However, sometimes you may want to share this demo with others.  Roland Bouman has a nice blog entry on the specifics of how to change the demo install into a server. 

I add the following line to my start-pentaho.sh to make the hostname changing transparent. 

sed -i -e “s/http:\/\/.*:8080/http:\/\/`hostname -f`:8080/” jboss/server/default/deploy/pentaho.war/WEB-INF/web.xml

This allows one to move this “pentaho” to any system and it will startup properly with the http://actualhostname.company.com:8080 instead of http://localhost:8080.  I download a new build of Pentaho on about a weekly basis in addition to preparing virtual machines and zipped installs for customers, partners.  This little shortcut is an absolute must for me; it doesn’t make sense in the actual code release for a variety of reasons.

Perhaps someone else will find this little tidbit useful!  Enjoy!

Command line ETL Job Execution

I know this might seem pretty obivous to those that use Kettle frequently, but there’s a VERY easy way to execute Kettle jobs at the command line. Kitchen is the command line interface and is quite convenient for executing that ETL job you’ve built. Crontab anyone?

kitchen.sh -file=/mnt/pentaho-professional/pentaho-solutions/software-quality/data/etl/jira_do_everything.kjb
-OR-
kitchen.bat -file=c:\dir\jira_do_everything.kjb
kitchen.bat /file:”c:\dir\jira_do_everything.kjb” (from comments below, thanks!!!)

Does anyone use kitchen or pan and have any best practices or suggestions to offer?

Pentaho tops 4.4 Million USD in open source code

Startups are interesting: Some days you love your job, other days you want to throw yourself out the window.  Yesterday I hated my job, for a variety of reasons.  One of the things that cheers me up when I’m in the midst of some tough stuff is looking at the big picture.

To date, Pentaho has built more than 313,981 lines of open source code.  It’s an estimated 81 person years.  At 55,000 USD / year for a developer that roughly equates to about 4,400,000 USD of “code” built and released under a business friendly, OSI approved, open source license (MPL).

WOW!

We put the vast majority of our stuff into the open source project (more than 80%); it’s a complete product in and of itself and that’s something I personally am proud of.  I’ve added the “OHLOH” badge for Pentaho to the upper right hand corner so there’s a ticker on this page to keep track of the breadth, size, and investment in the open source edition of Pentaho:

Incidentally, the metrics are calculated by a very cool upstart ohloh.  They slurp data from source control systems and display cool metrics about projects, like ours.  Check them out!

Trend Lines in Mondrian

I often mouth off on the importance and power of getting your data into a star-schema and Mondrian; the power you have to respond to time variant and analytic needs of your users is immense.  In the next few weeks I’ll cover more about these powers in a more concrete form, showing specific examples instead of just alluding to them.

Starting with a relatively straightforward implementation of a Trend Line.  Traditionally a trend line is built using a good old fashion linear regression on a set of data and then used to calculated current and future X and Y coordinates.  This usually involves some knowledge about building the linear regression formula, and then calculating points based on it.  Fortunately for us, we can skip most of this tedious process and just use an MDX function, LinRegPoint, to sort out most of that difficulty and we’ll just enjoy a beautiful trend line on our graph.

Let’s start with the output, so it’s clear what we’re talking about:

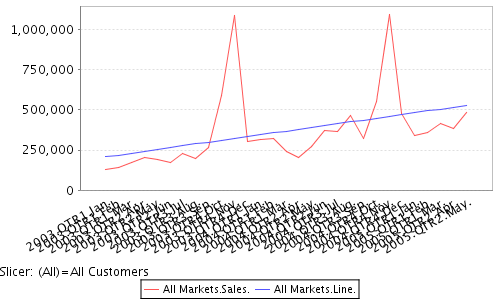
The RED is the data set, and the BLUE is the trend line we’ve built using MDX.

The only thing you need to run through this tip is the Pentaho Demo download, available at http://www.pentaho.org/download/latest.  I used 1.2RC2 for this example, but it should work on versions more recent than that.  It’s zero installation and starts up with everything you need for this tip.

Start up pentaho (start-pentaho.bat) and hop into your web browser (http://localhost:8080).  Navigate to the “Samples” section and into “Steel Wheels.”  Steel Wheels is an example we’re shipping with the demo installation now which provides some great time variant data examples (needed to do interesting things with OLAP).  Steel Wheels data is the sample data provided by the BIRT folks at Eclipse, actually.

Navigate to the Analysis folder, and then to “01. Territory Analysis by Year.”  It doesn’t really matter which one, we just need to get into JPivot on our Steel Wheels cube. 

Click on the MDX button and paste the following MDX fragment to get a base “sales view” and hit Apply:

select {[Measures].[Sales]} ON COLUMNS,
  {[Time].[Months].Members} ON ROWS
from [SteelWheelsSales]
where [Customers].[All Customers]

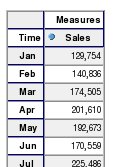
You should get a result that looks like this:

Ok… Now it’s time to build our Calculated Member.  This is kind of hairy: it requires some technical prowess to get the MDX calculation correct.  Just remember, once you’ve got the calcuation working properly you can include it as part of the Cube so your business users (using JPivot or Pentaho Spreadsheet Services) don’t see that complexity.

We’re going to use an MDX function, named LinRegPoint (reference link). I think the best online tutorial was done by Mosha Pasumanksy in his blog entitled “Using Linear Regression MDX functions for forecasting”  I used his tutorial to help build the regression below!  I won’t get into the details of linear regressions; you can read the reference or do some other googling for Linear Regressions. 

Basically, you rank Time to get straight numbers (X coordinates: 1,2,3,4,5), use your measure Sales as your value to regress (Y coordinates: 129754, 140836, …) and then you get it the ranked time as INPUT to your Linear Regression (which time is this) and it CALCULATES the Y output based on the Linear Regression it’s built.

Our LinRegPoint MDX formula comes down to:

LinRegPoint(
  Rank(
     [Time].CurrentMember,
     [Time].CurrentMember.Level.Members),
  {[Time].CurrentMember.Level.Members},
   [Measures].[Sales],
   Rank(
       [Time].CurrentMember,
       [Time].CurrentMember.Level.Members)
)

Enter the following MDX Fragment into the MDX editor to see the results of the Linear regression on Steel Wheels.

with member [Measures].[Line] as
‘LinRegPoint(Rank([Time].CurrentMember,
[Time].CurrentMember.Level.Members),
{[Time].CurrentMember.Level.Members}, [Measures].[Sales],
Rank([Time].CurrentMember, [Time].CurrentMember.Level.Members))’
select Crossjoin({[Markets].[All Markets]}, {[Measures].[Sales], [Measures].[Line]}) ON COLUMNS,
  {[Time].[Months].Members} ON ROWS
from [SteelWheelsSales]
where [Customers].[All Customers]

And you should see the following output:

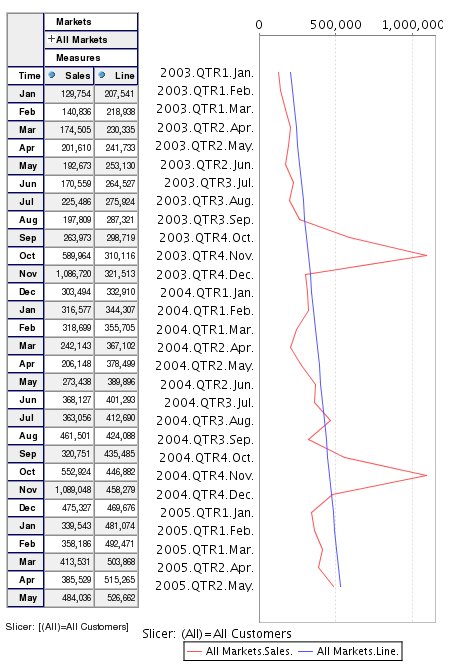
Note: if you want to see the graph on the right, change the chart settings (icons at top of page) to be a Horizontal Line chart, Width = 300 and Height = 600.

The steel wheels only has data extending to [2005].[May].  If we had “time” members extending beyond our data set the line would extend to the future.  Careful; a simple linear regression is not best practice for doing forecasting on MANY things.  However, business users like to see the overall trend, and slope.

Was this helpful?  What would you like to see next?  Rolling Averages?  It’s VERY IMPORTANT to note that in most circumstances “MDX examples” for Microsoft Analysis Services works with Pentaho.  There’s a dirth BUNCH of articles about MDX on MSAS… That’s a wealth of tutorials that apply to your work with Pentaho.

Sales Percent increase month to month, qtr to qtr

This is a common situation:  Don’t show me what my total sales figures were month after month, show me something that describes something important to my business.  ie, Sales Growth

Chris Webb, who runs a wildly popular MSFT blog in addition to being an in demand independent consultant, wrote an article on Previous Period Growth using Pentaho.  Mondrian (Pentaho Analysis Server) uses MDX, a powerful expressive multidimensional query language which Chris is one of the leading experts on its practical use and applications.

Chris outlines how to build a “custom” calculated measure that displays the Sales Previous Period Growth:

All you need is the zero install pentaho demo installation to run through his tech tip, available at http://www.pentaho.org/download/latest.php

Remember, this isn’t trivial (ie, writing MDX fragments) but it’s VERY VERY powerful.  Check out the Mondrian MDX reference here for some of the powerful analytic calculations available.  Remember, once you’ve got your MDX member working properly HIDE that complexity from your users by adding it to the Mondrian OLAP schema definition.

Sydney Training and Community Feedback

I had the recent good fortune of traveling to Sydney to deliver a “much sought after” scheduling of our “Building Analytic Solutions with Pentaho” class.  We did little advertising but it was packed (12 people, the maximum we ever do for public classes).

I love doing training courses for more advanced topics, like the Analytic solutions course.  I love it because it’s a chance to converse with other practitioners and share knowledge, experience, and war stories.  These experiences, and the camaraderie is invaluable when one tends to be the “lesser known” topics at an organization.  It’s GREAT to hear about open source adoption in the enterprise; stories of countless millions being saved, people feeling empowered to make their infrastructure and applications what THEY want instead of what their VENDORS want.  It’s just nice to connect with people of similar interests.

It’s also a chance to hear some validation for strong points and deficiencies in Pentaho’s open source strategy.  I have my own opinions, as someone who uses the software day in day out on real customer problems.  It’s great to hear that others either feel the same way or disagree; because that’s the nature of this community driven process.  It doesn’t really matter what I think the product should be like (I work for the vendor right?) it matters what customers and community want.  I think feature X is awful, doesn’t work properly and is total crap.  OK.  If community members find it entirely suitable for their needs, and say “Go work on feature Y” then that’s PERFECT.

This is the most effecient part of open source:  The closer you are to your customer, the closer you are to your market, the closer you are to the pain or joy, the more likely you are to make better product.  Cutting out the middle men (in many cases, account managers and product managers and development managers, etc).

Thank you, Sydney trainees for sharing your praises and criticisms.  I’ll bring them to those that can actually do something about it (ie, Java Jockeys). 

PS – Based on the training people like more of our product than dislike AND I was right about Feature X.  🙂

Pentaho Linux .sh files

Small little tip:

The pentaho build process doesn’t currently manage the permissions on .sh files properly.  When you download the daily builds or other demo installations you may get some errors (bash command not founds, etc).  You need to change to executable all .sh files in the installation.  Use the following command in the “pentaho-demo” directory.

for x in `find . -name ‘*.sh’`; do chmod +x $x; done

Hope you find this helpful!